Get the best loyalty & customer engagement platform out there!
- Design industry shaping loyalty programs
- Integrate easily and go live quicker
- Deliver hyper-personalized consumer experiences
Capillary: Recognized as a Leader in Everest Group’s PEAK Matrix® 2025 Read more >
The Balanced Loyalty Quotient Report 2026 is now live — our largest and most in-depth loyalty report yet. Download Report >

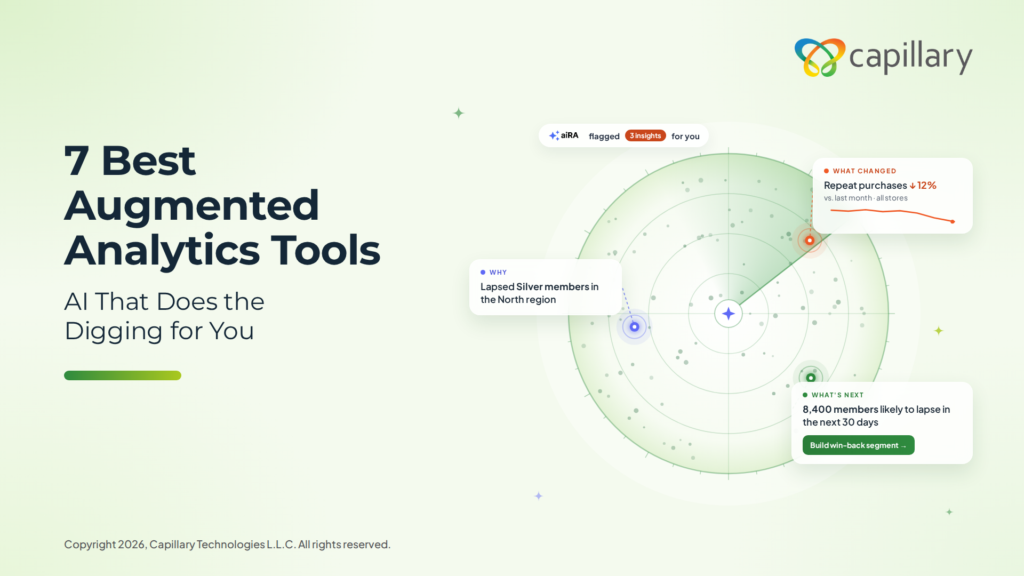
Most dashboards show you what happened, but they leave the digging to your team. Augmented analytics does that digging for you. It scans your data, flags what changed, and shows you why it happened.
For marketing and CRM teams, this saves time. You can spot a drop in repeat purchases early and respond before it grows.
In this guide, we explain what augmented analytics is and what to look for in a tool. We also compare seven tools to help you find the right fit for your team.
Augmented analytics uses AI to handle part of the analysis work for your team. It looks for patterns in your data and explains why a metric went up or down. It can also predict what is likely to happen next. The key difference is that it does this without waiting for someone to ask.
Traditional BI tools show charts and reports, and your team has to decide what to look for. With augmented analytics, the important changes come to you. To learn more about tools that answer questions in plain language, read our guide to conversational analytics tools.
Marketing and CRM teams need more than a faster way to read data. The right tool should help you understand your customers and act on what you learn. Here are five things to check before you choose one:
An augmented analytics tool should do some of the thinking for your team. It should point out what changed, explain it clearly, and help you decide what to do next. It should also do this without months of setup.
We used these ideas to build our criteria. Here are the questions we asked about each tool:
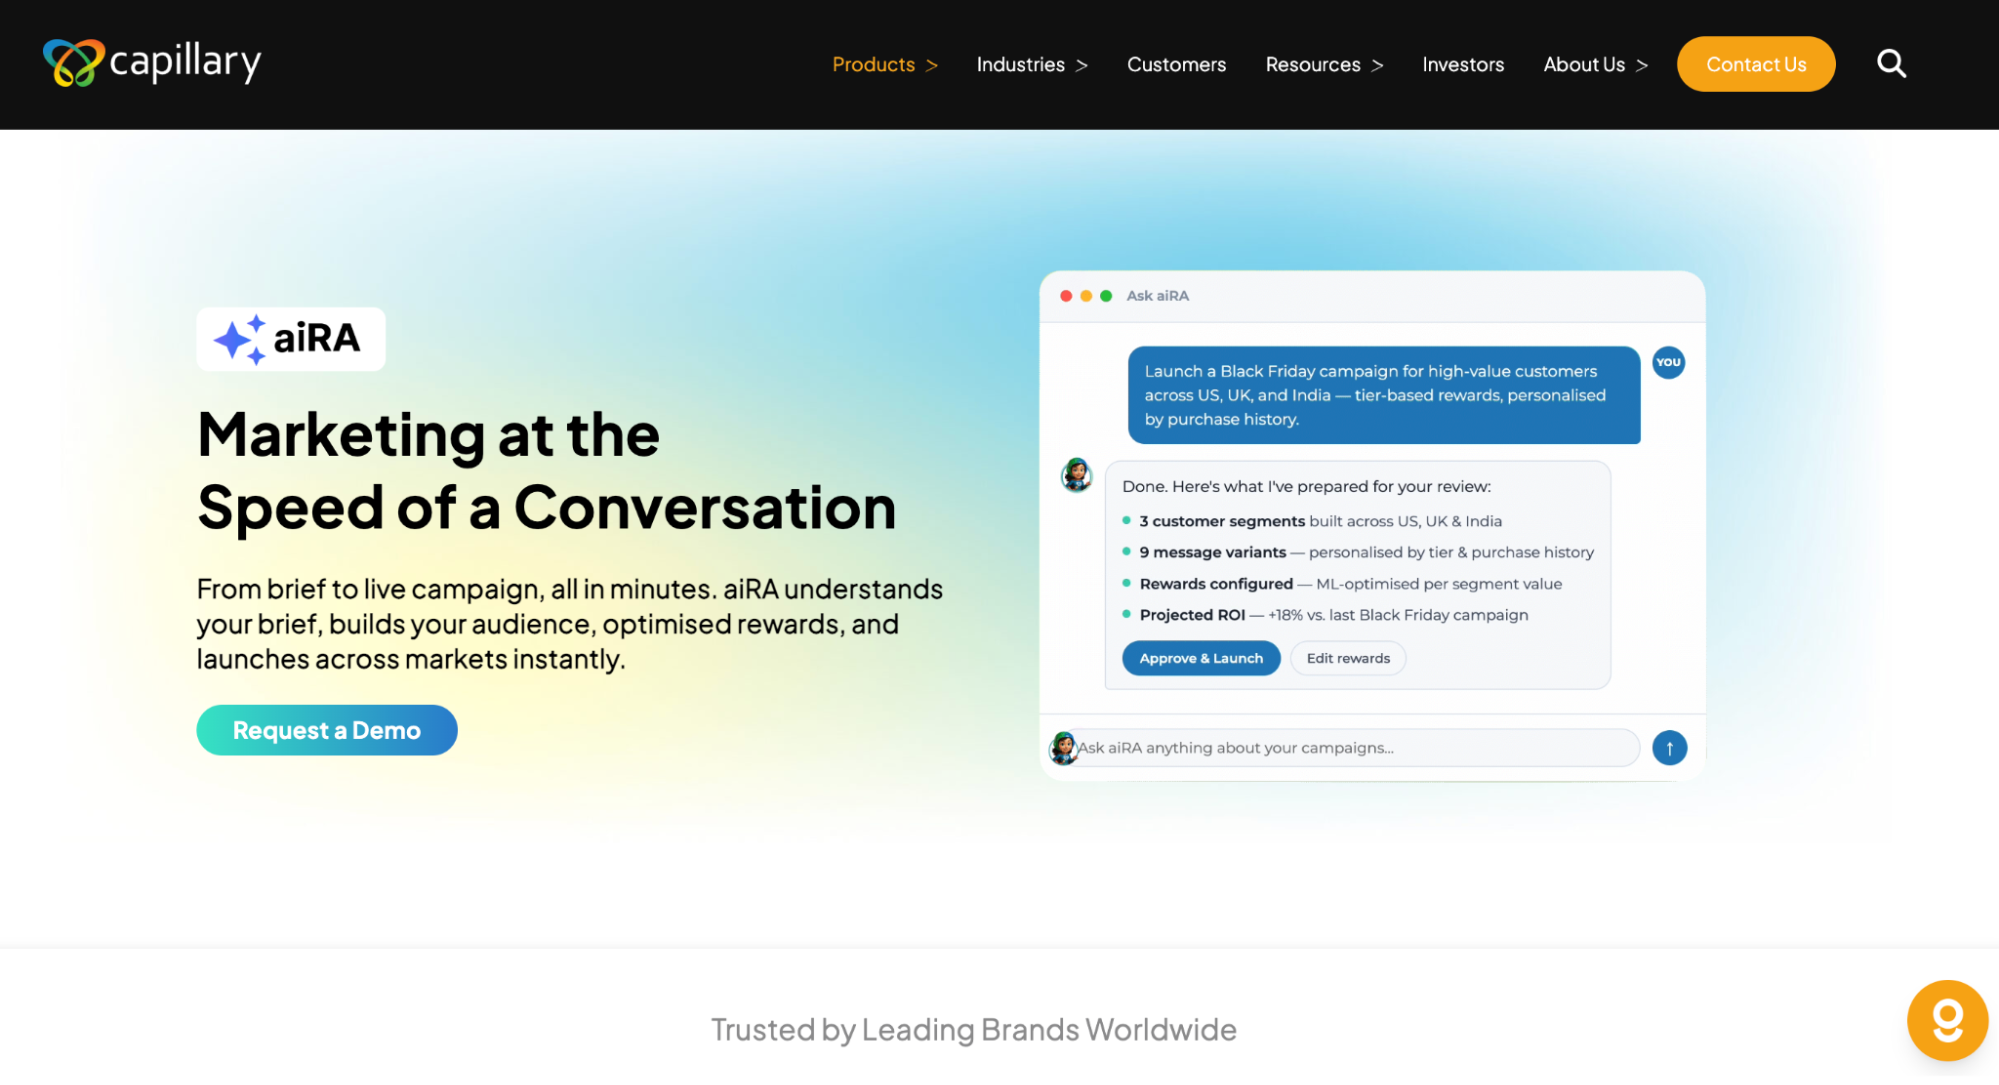
Best for: Marketing and CRM teams that want to move from a customer question to a live campaign.
aiRA by Capillary is an AI agent for marketing and customer teams. Users ask questions about customers in plain English. aiRA by Capillary answers from the brand’s own customer data. Then it recommends offers, messages, and channels.
The tool suits teams that run frequent campaigns. Every customer-facing step can wait for human approval. A full deployment on brand data takes two to four weeks. Your team gets a dedicated success manager throughout.
Key features
See how aiRA by Capillary handles a real question from your own customer data.
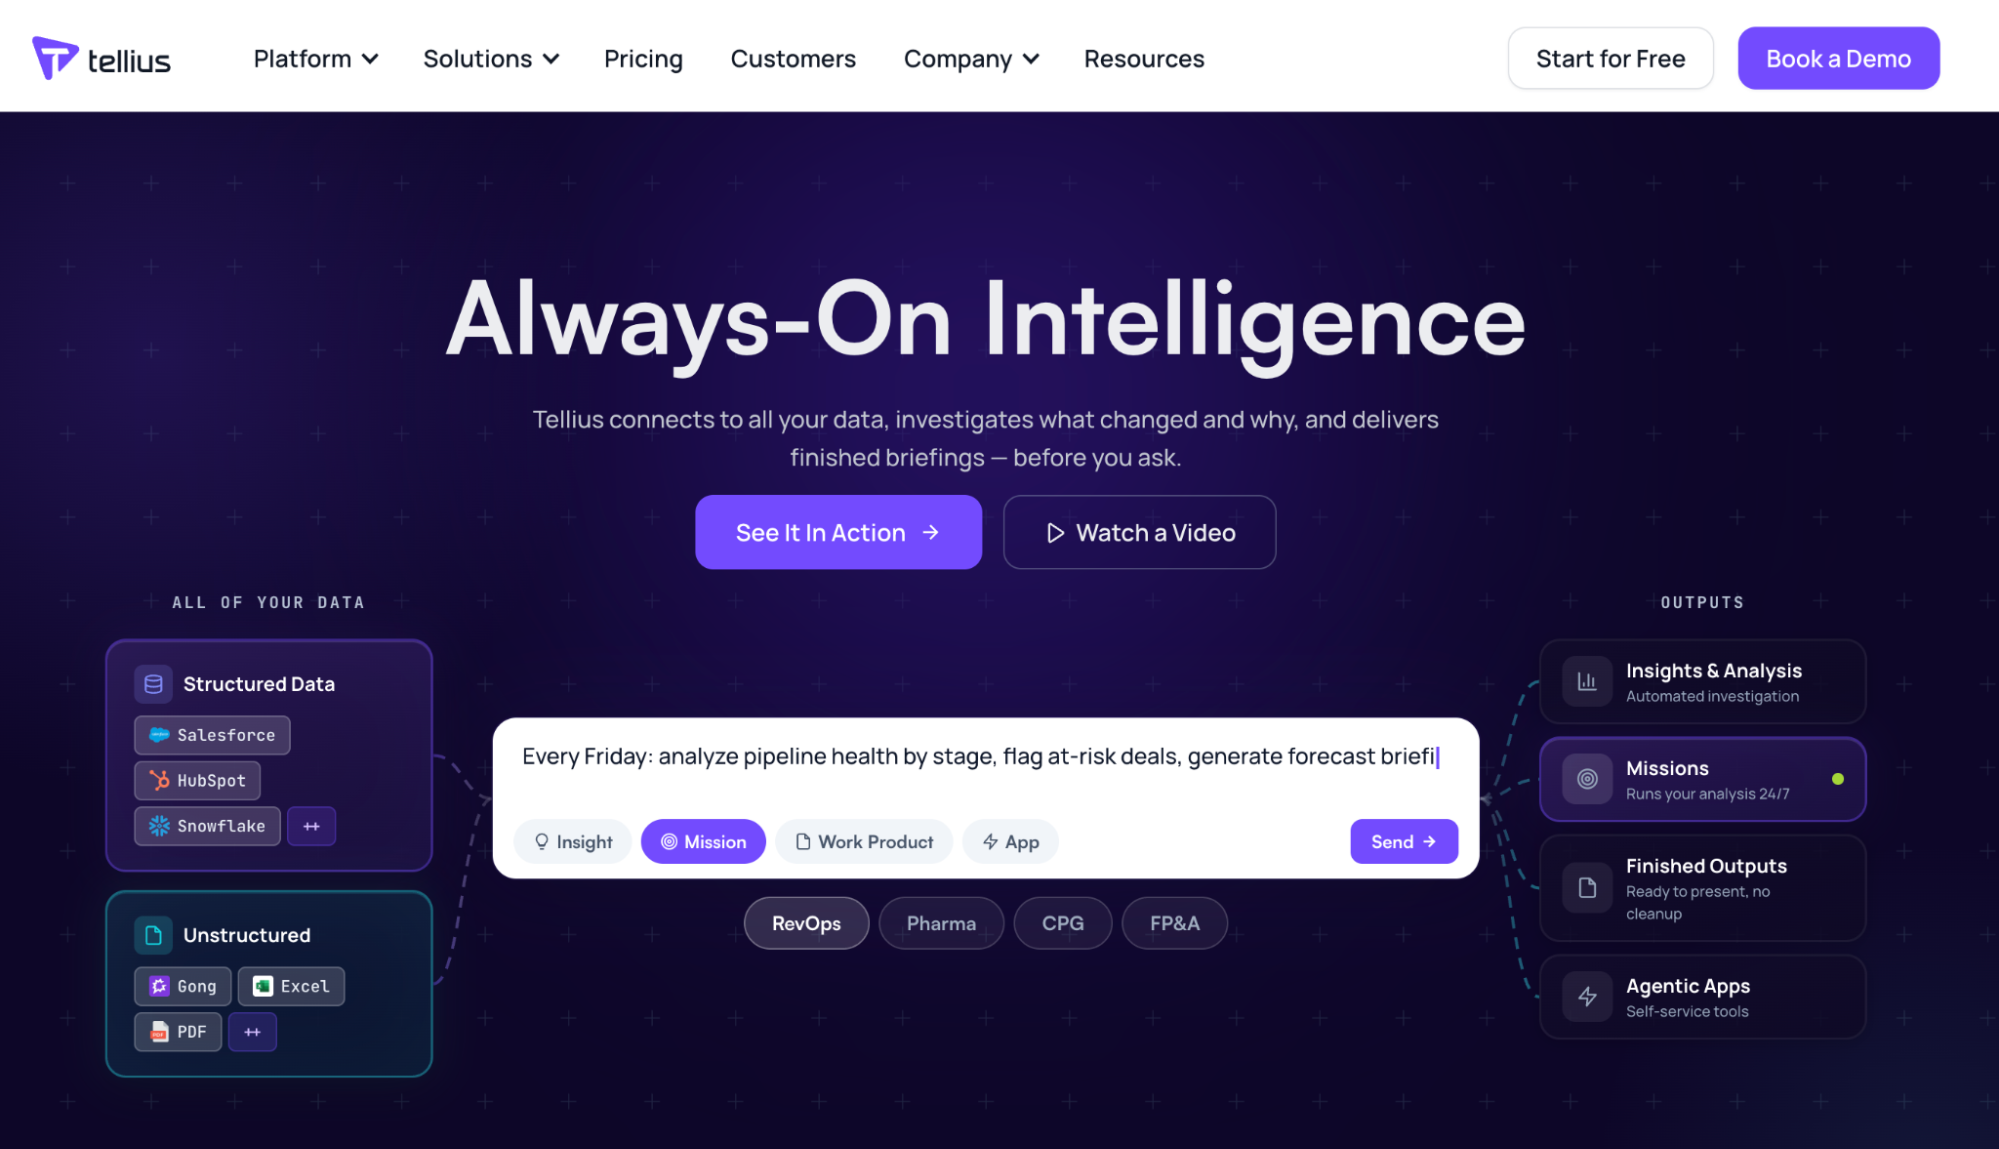
Best for: Business users who want automatic explanations of metric changes.
Tellius is an augmented analytics platform built around explanation. Users ask questions in natural language. The platform finds the factors behind a change in a metric. It also surfaces patterns nobody asked about.
Tellius suits business teams with clear metrics and a data team to connect sources. Teams that need heavily customized dashboards may need a second tool. They built the product for investigation first.
Key features
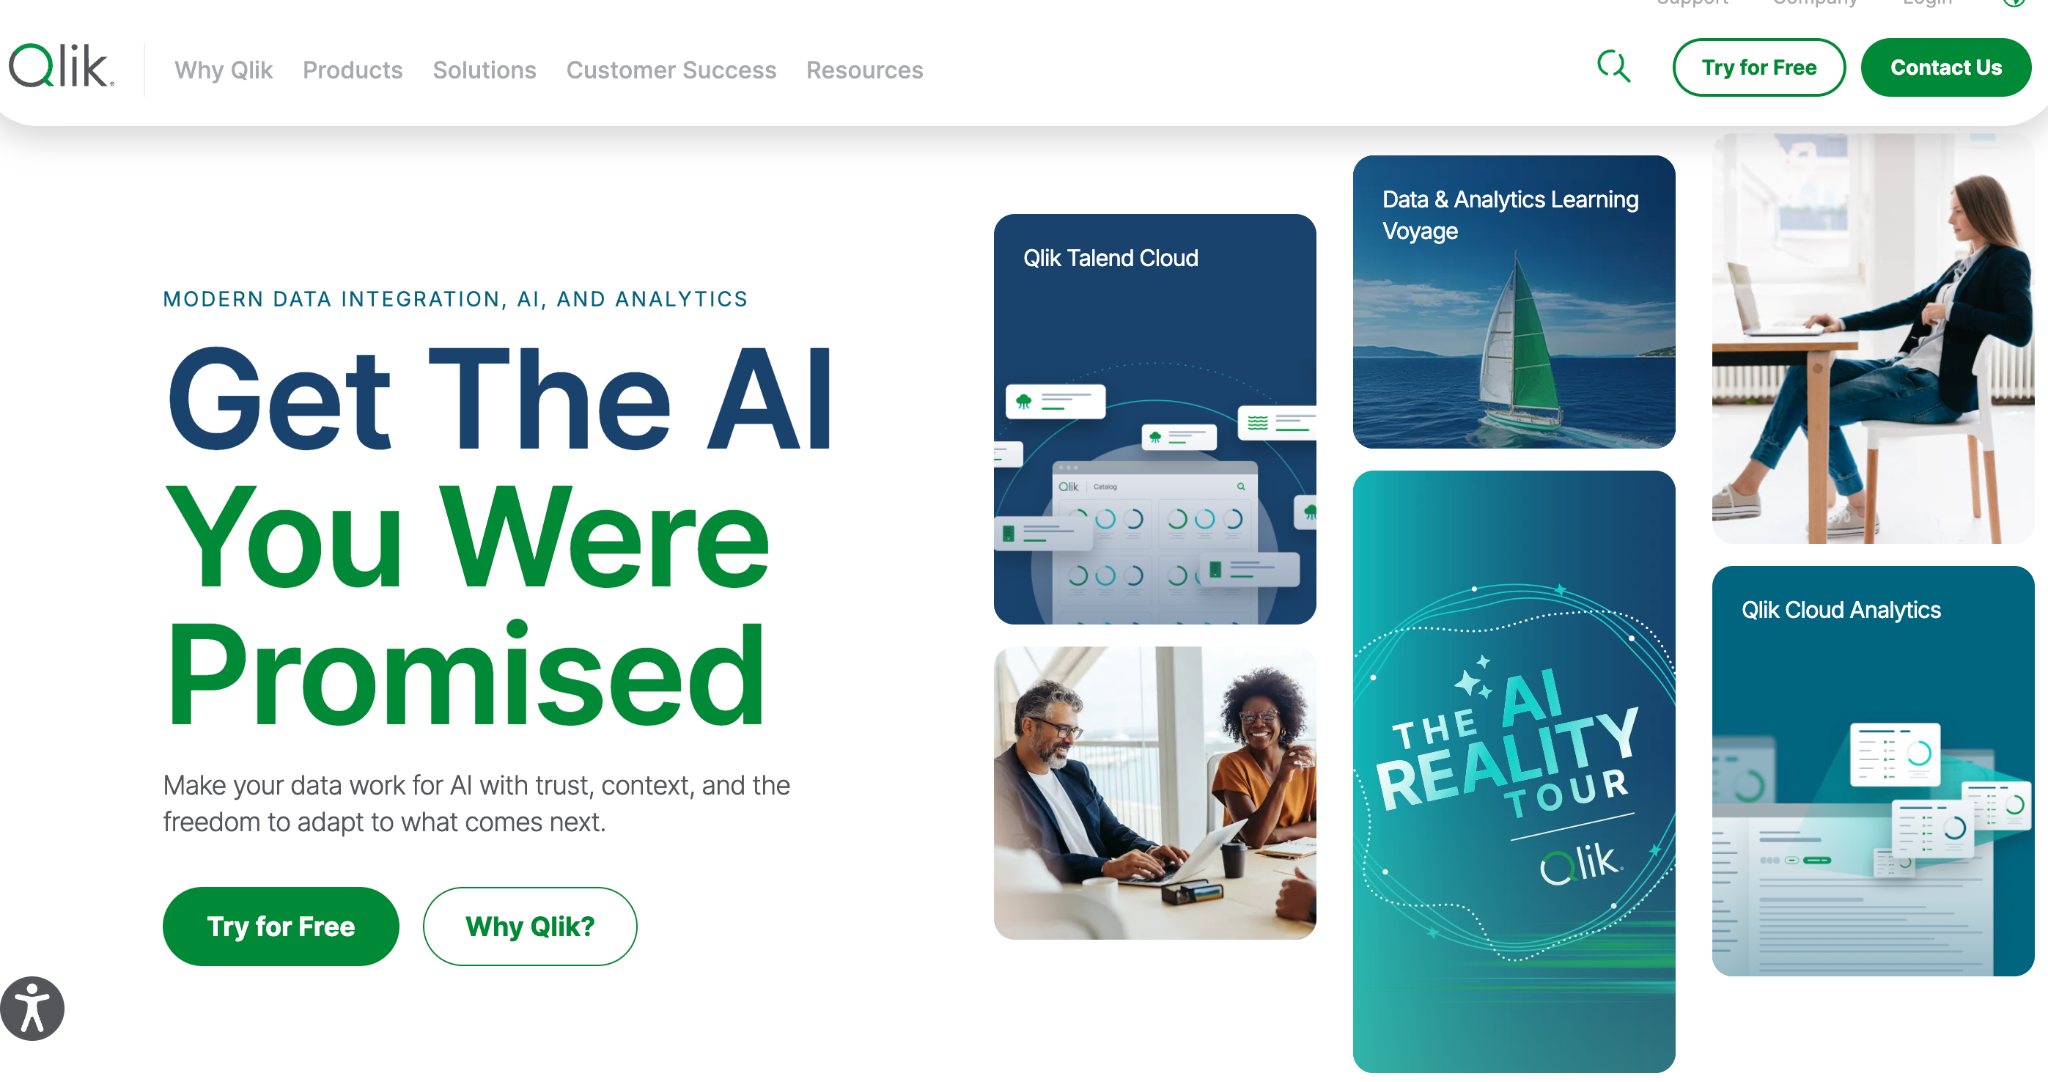
Best for: Teams that want to explore data from many sources and get AI-generated insights.
Qlik Cloud Analytics is the cloud platform from Qlik for analytics and AI-driven insight. It builds on the associative engine in Qlik Sense. Users can click through data in any direction. The platform adds AI assistance to speed up discovery.
Qlik suits organizations with BI developers who build data models for the business. New users need time to learn load scripts. Business users get the most from the platform once that groundwork is ready. They offer both cloud and on-premises deployment.
Key features
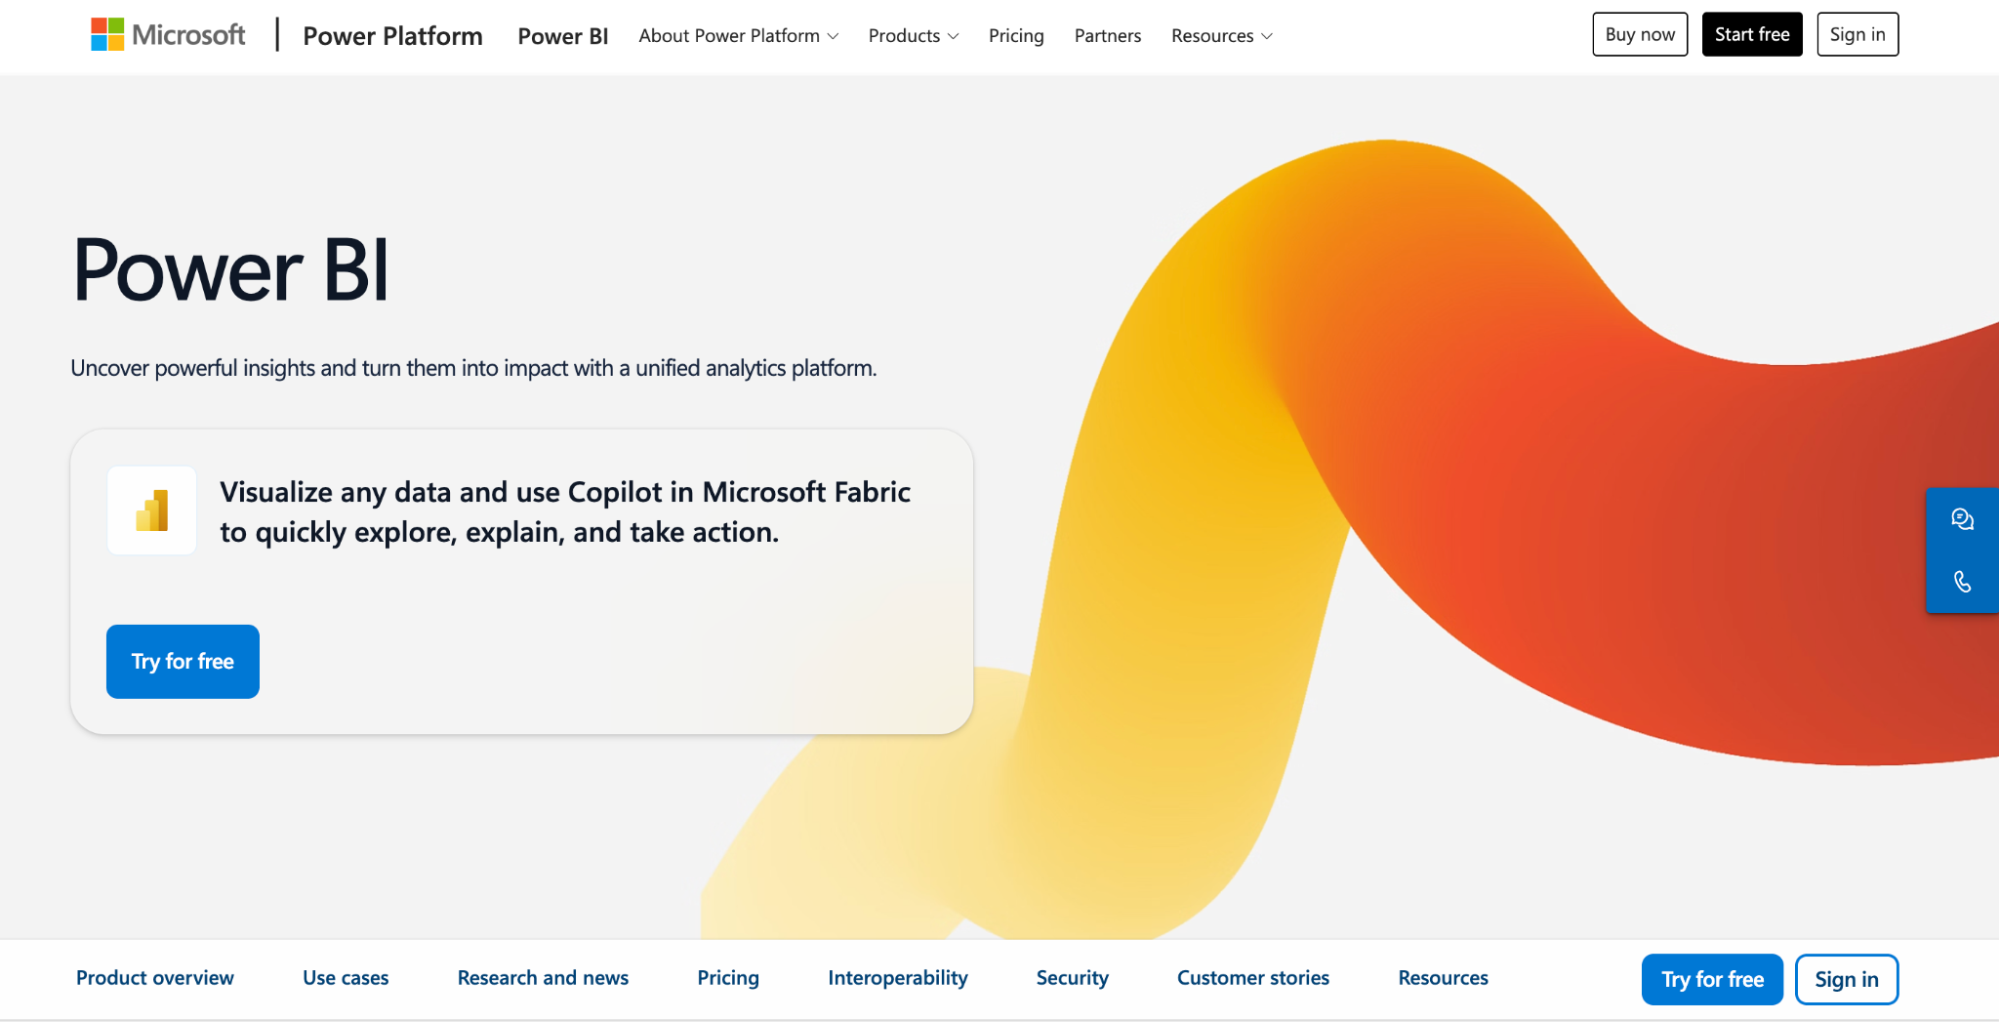
Best for: Organizations that run on Microsoft 365 and want reporting inside that ecosystem.
Power BI is the business intelligence platform from Microsoft. It connects to Excel, SQL databases, and cloud sources. Quick insights surfaces patterns in a dataset. Copilot answers questions in plain language and helps build reports.
Power BI suits companies that already use Excel, SharePoint, and Teams. It works best with BI developers who maintain the data models. Basic reports come together quickly. Advanced analysis often needs DAX and modeling skills.
Key features
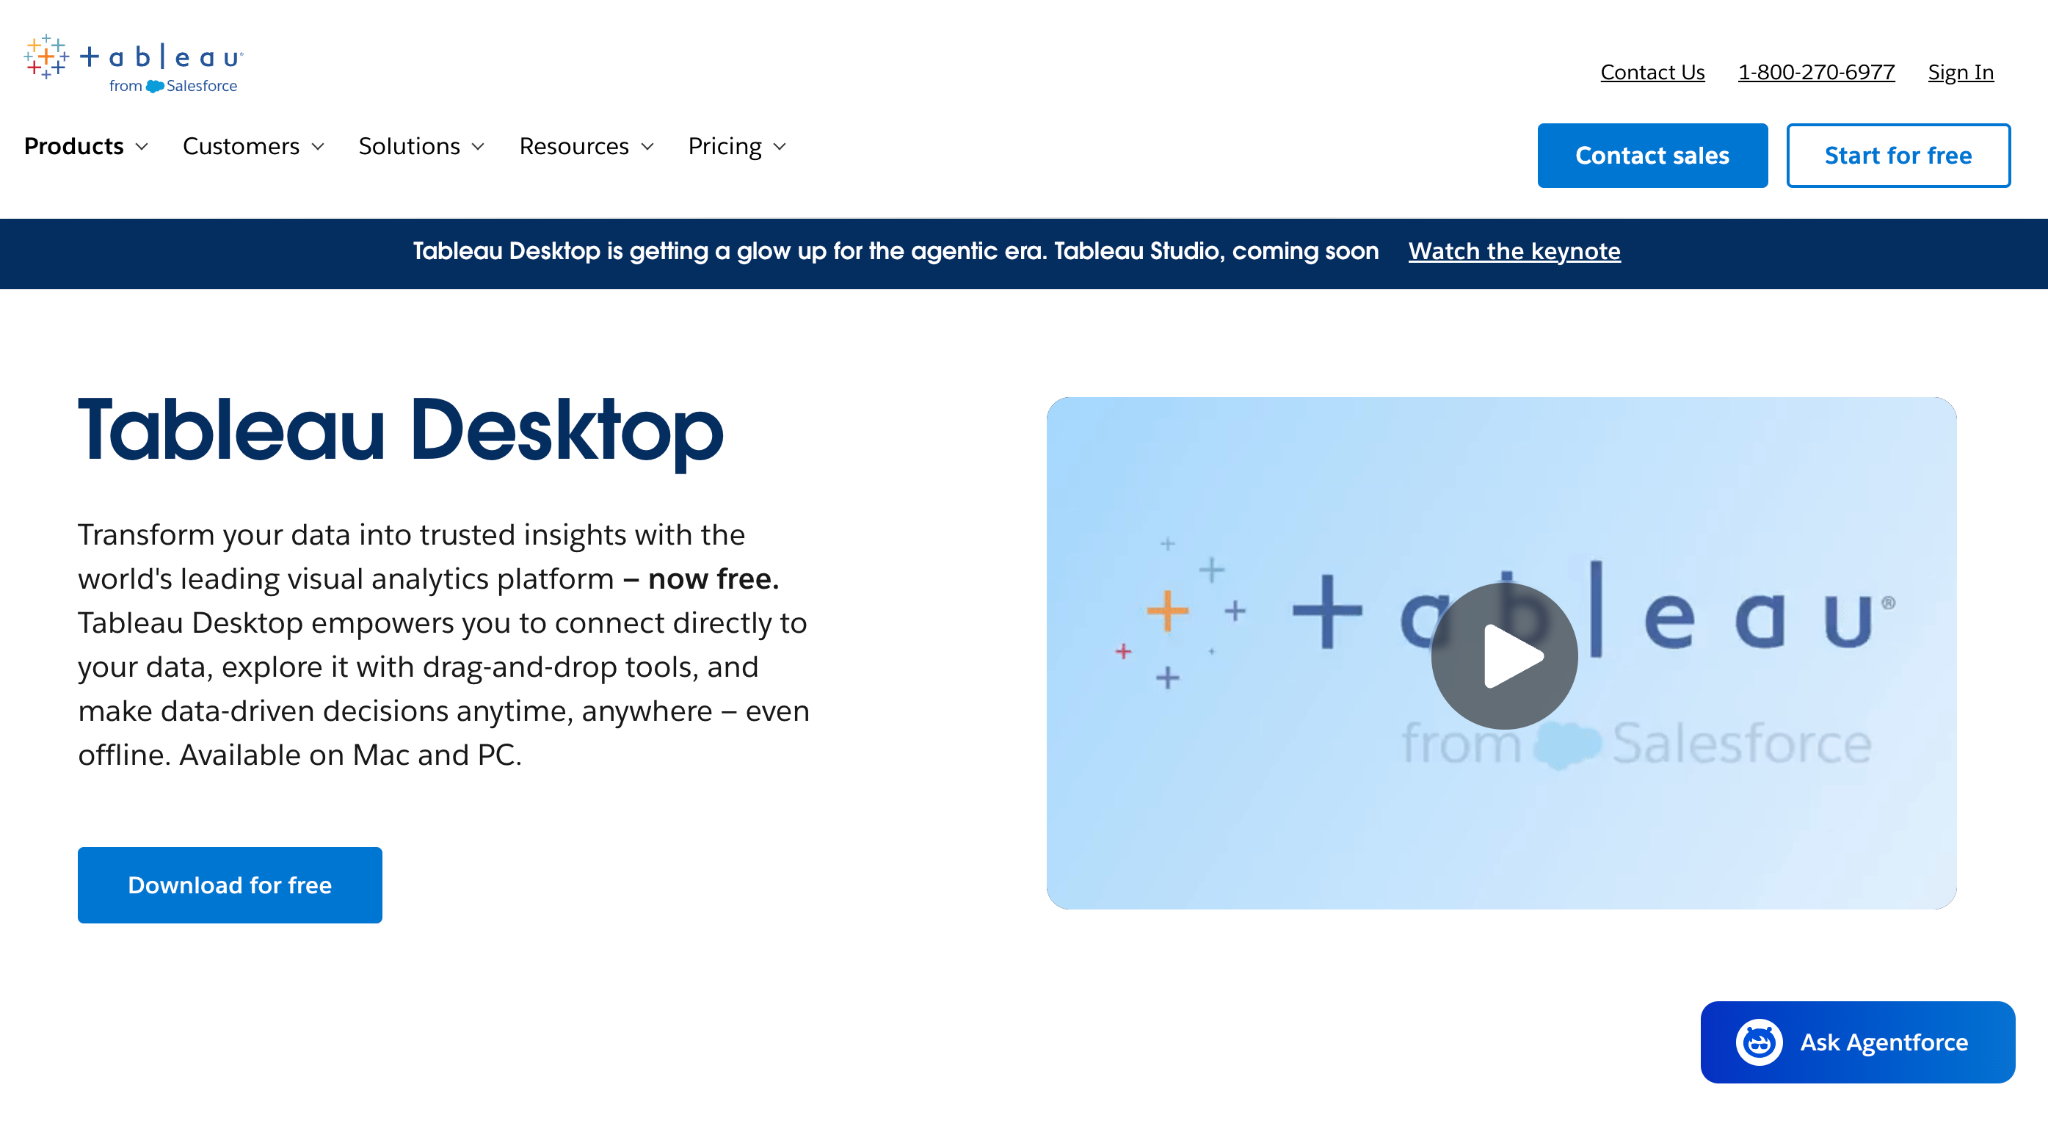
Best for: Analyst teams that build visual dashboards for other people.
Tableau is a BI platform from Salesforce built around visual analysis. Tableau Pulse tracks key metrics and sends alerts when they change. Explain Data suggests possible causes for a value in a chart.
Tableau works best when analysts design and maintain dashboards. Business users can explore those dashboards. When their questions change, they usually wait for analysts to build new views.
Key features
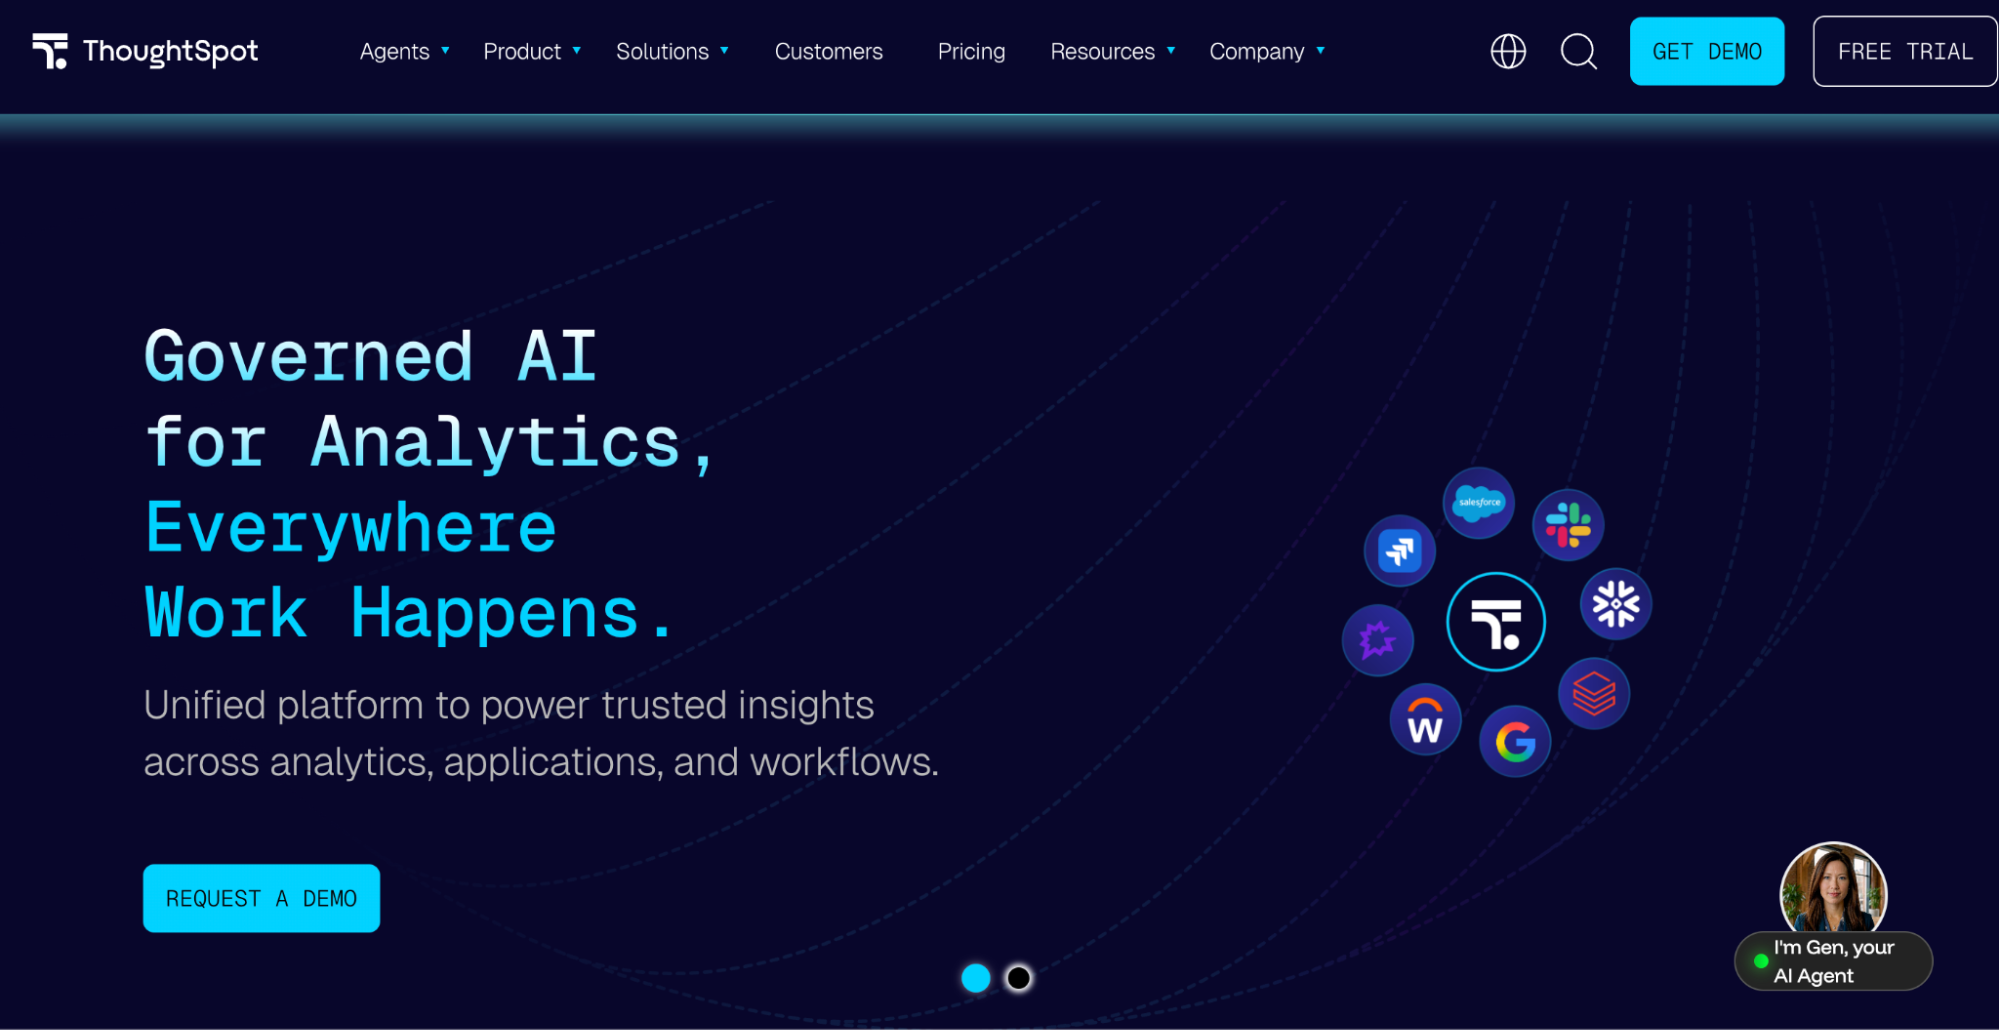
Best for: Teams that want search-led exploration of data and automated analysis.
ThoughtSpot is an analytics platform built around search. Users type questions about their data and get charts back. SpotIQ runs automated analysis to find patterns and outliers that users may have missed.
ThoughtSpot works best after a data team models the warehouse. Teams that need answers before that work is done may find setup slow. Much of the functionality depends on good data modeling.
Key features
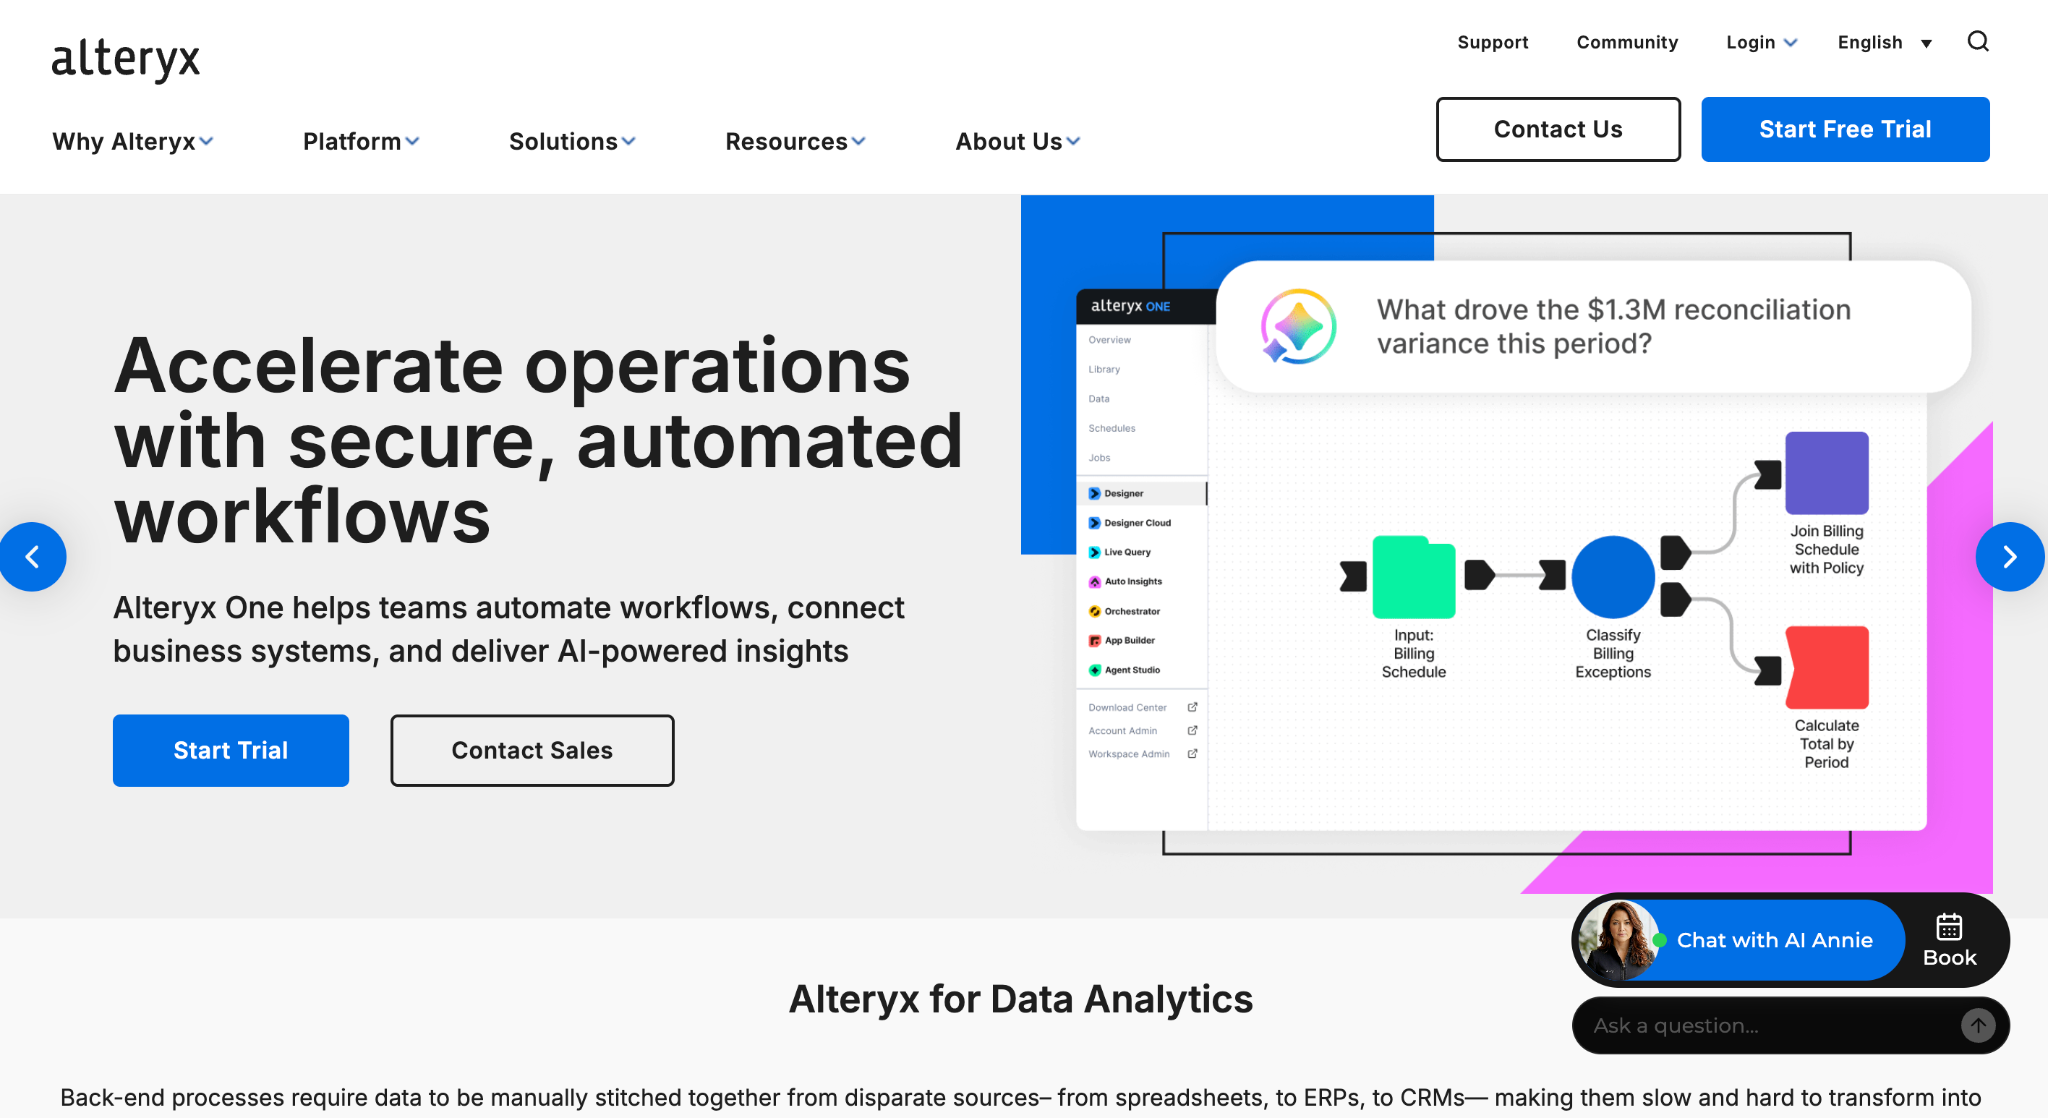
Best for: Analysts who want to automate data prep and analytics in no-code workflows.
Alteryx is an analytics automation platform. Users build workflows by connecting tools on a canvas. The platform combines data preparation, analysis, and predictive modeling in one place.
Alteryx suits analyst teams that prepare data and run repeatable workflows. Marketing teams can use the outputs for segmentation and reporting. An analyst usually builds the workflow first. Business users who want plain-English answers may find the tool less direct.
Key features
Augmented analytics is most useful when it helps marketing and CRM teams act on what they find. Here are four common use cases:
Augmented analytics watches engagement and purchase patterns across customers. It flags groups that start to slow down. Your team can act before those customers lapse. The best tools also explain which behaviors signal the risk.
When a campaign falls short, the first question is what changed. Augmented analytics compares segments and offers to find the driver behind the drop. With that cause in hand, a team can respond within days rather than weeks.
Predictive models can estimate how a campaign may perform before launch. Teams can compare options and fund the one most likely to work. Forecasts improve as the tool learns from each campaign.
Some customers are far more likely to respond to an offer than others. Augmented analytics groups customers by how likely they are to respond and how much they are worth. That lets your team direct budget toward the customers most likely to buy.
Augmented analytics shows you why a metric changed. For marketing and CRM teams, that is only the first step. The next step is using that insight to plan and launch a campaign.
Each tool on this list works in a different way. Some are made for analysts who build dashboards for other teams. Others let business users look at data on their own. If you want to find an insight and launch a campaign in one place, choose a tool that does both.
aiRA by Capillary is built for that. Your team can ask questions about customers in plain English, build segments with projected value, and set up campaigns that are ready to launch. A person on your team approves every customer-facing step before it goes live.
Request a demo to see how aiRA by Capillary works on your own customer data.
Augmented analytics uses AI to find patterns, explain changes, and forecast results. It does this with little prompting from the user.
Traditional BI presents reports that people must interpret. Augmented analytics adds automated discovery, explanation, and prediction.
Conversational analytics lets users ask questions in plain language. Augmented analytics adds discovery and prediction. Many tools now offer both.
The tool handles routine questions and first-pass analysis. Analysts still build data models, review results, and handle complex work.
aiRA by Capillary is built for marketing and CRM teams. It answers customer questions and helps launch campaigns. People approve each customer-facing step.

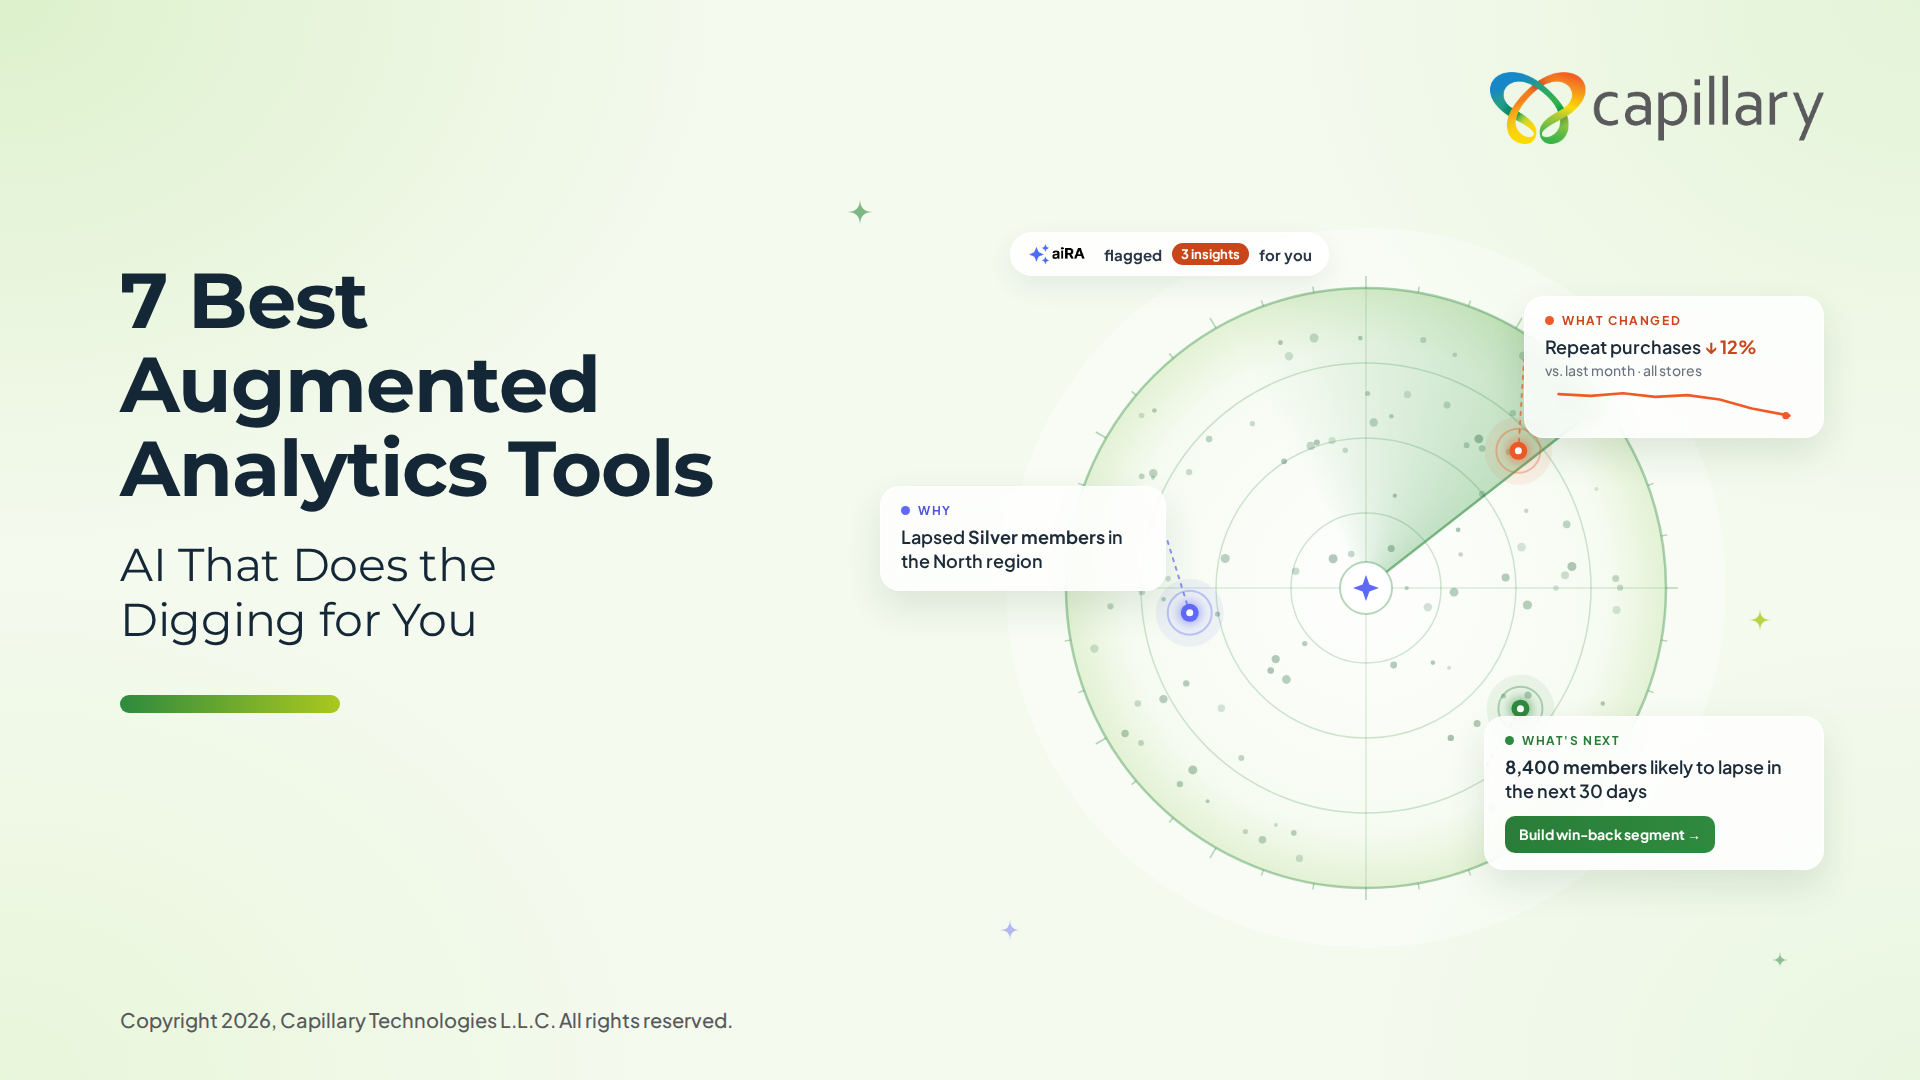
Analytics and Insights
7 Best Augmented Analytics Tools for Marketing and CRM Teams in 2026Most dashboards show you what happened, but they leave the digging to your team. Augmented
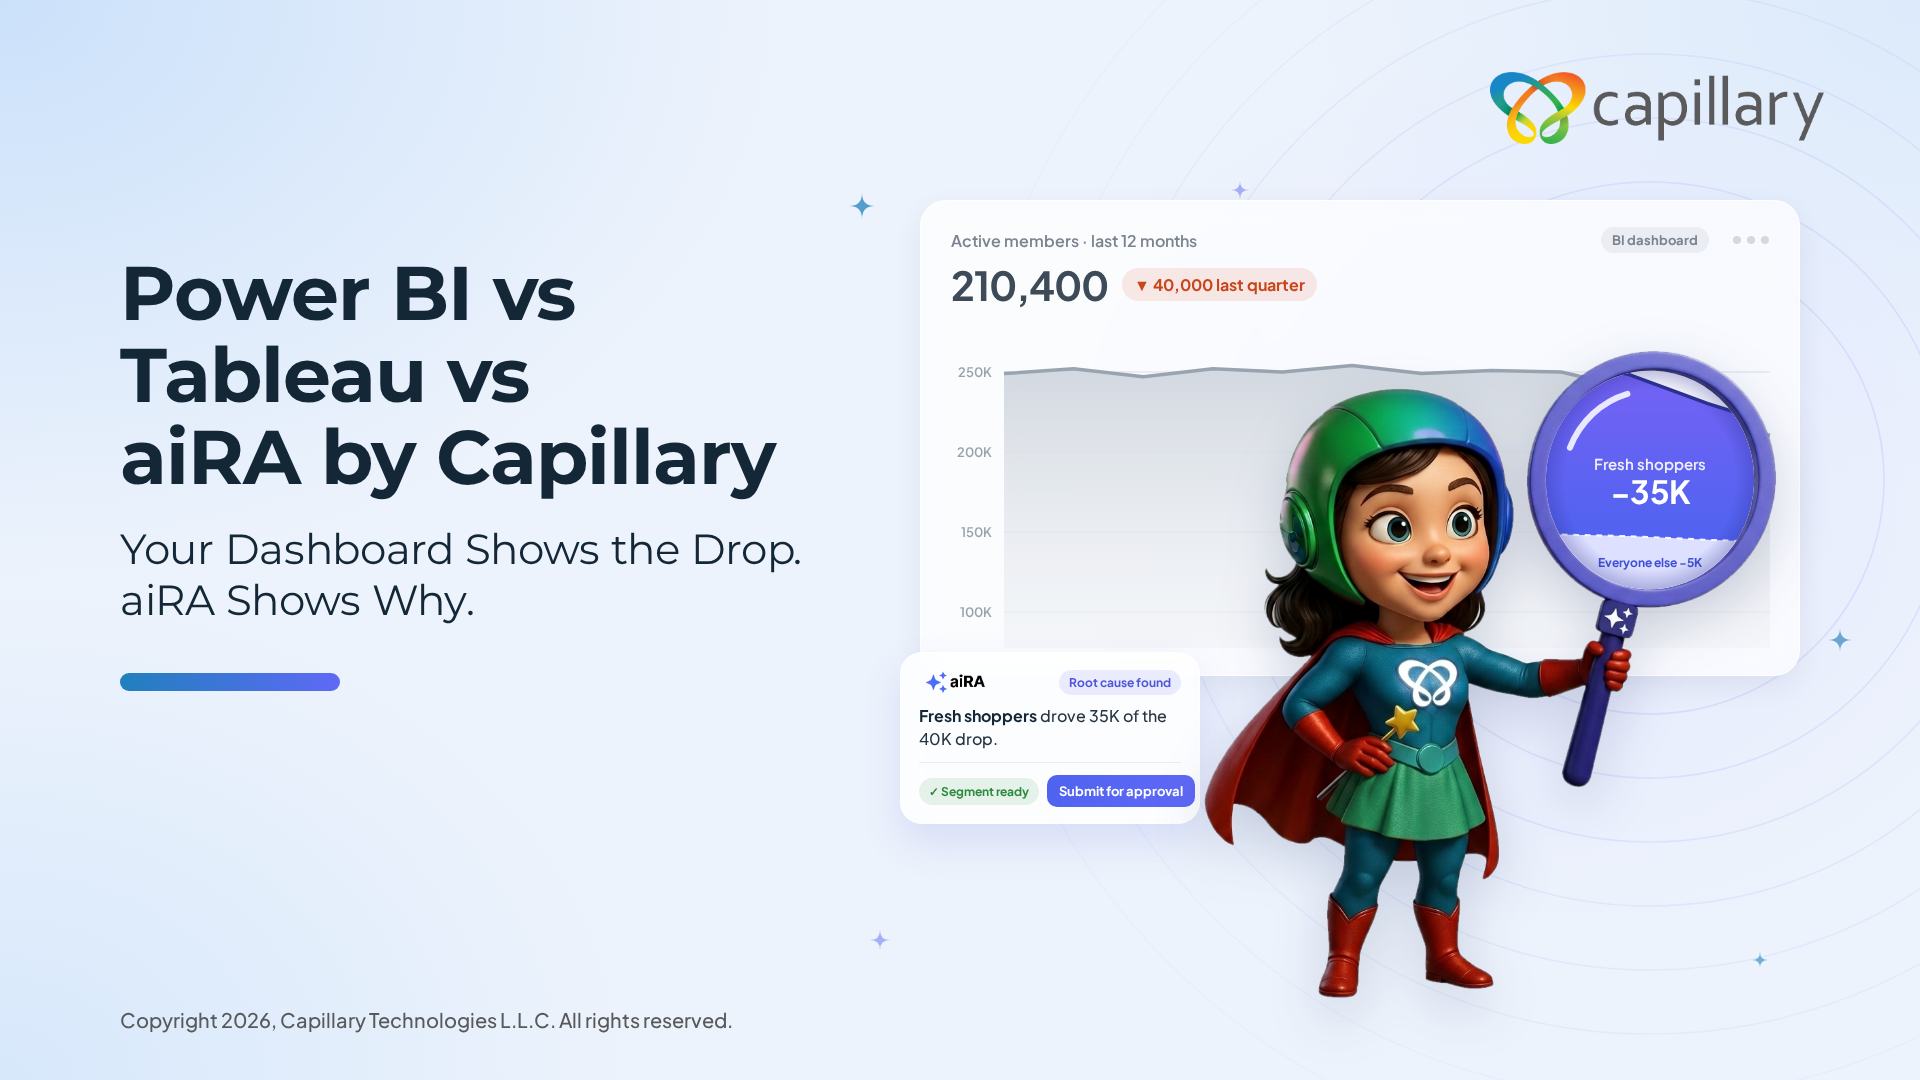
Blogs
Power BI vs Tableau vs aiRAYour Dashboard Shows the Drop. aiRA Shows Why, & What to Do About It. Power
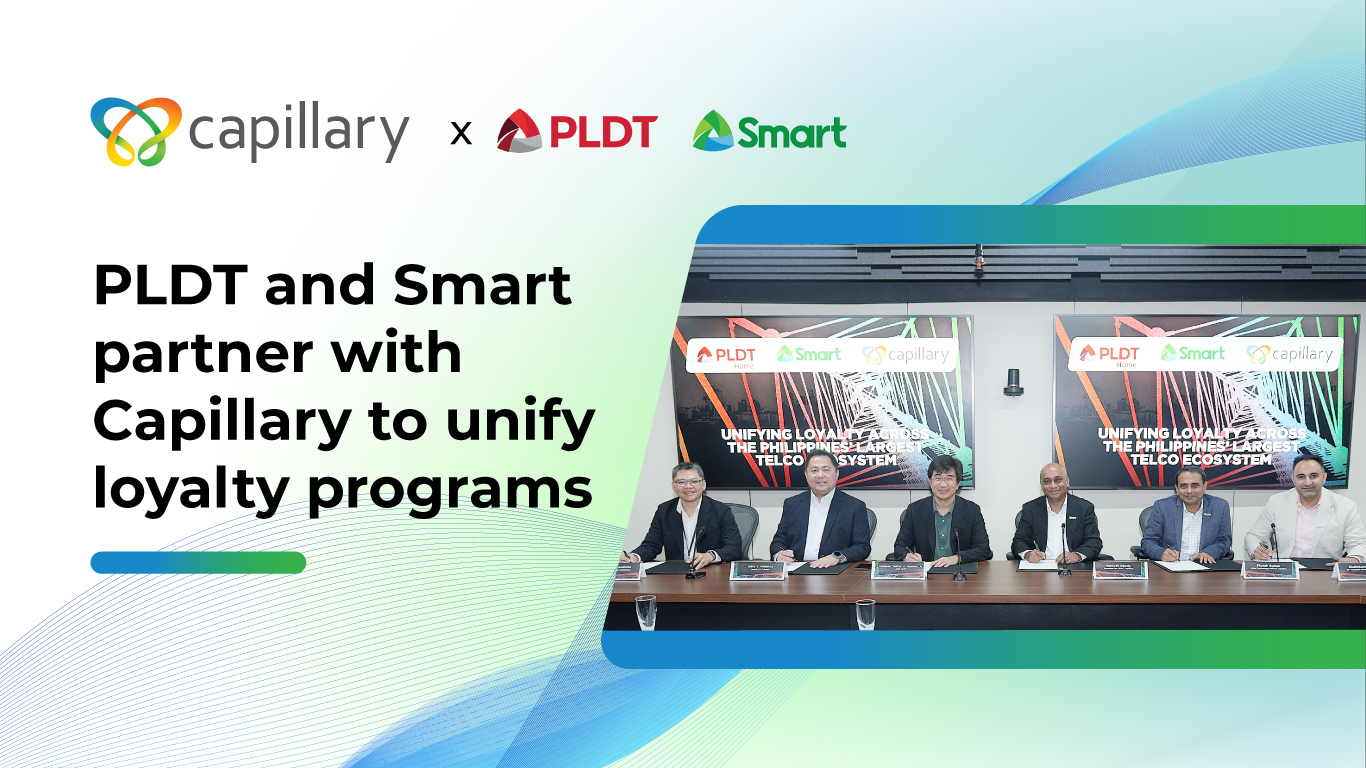
News
PLDT and Smart partner with Capillary to unify loyalty programsCapillary Marcom