Get the best loyalty & customer engagement platform out there!
- Design industry shaping loyalty programs
- Integrate easily and go live quicker
- Deliver hyper-personalized consumer experiences
Capillary: Recognized as a Leader in Everest Group’s PEAK Matrix® 2025 Read more >
The Balanced Loyalty Quotient Report 2026 is now live — our largest and most in-depth loyalty report yet. Download Report >

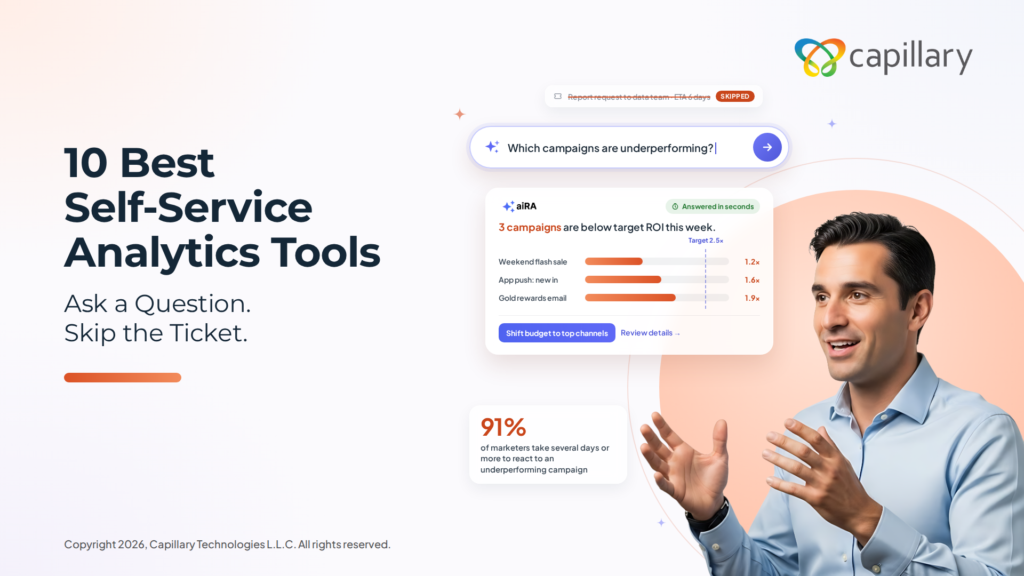
Marketing teams run on data, but getting a straight answer out of that data is another story. Reports sit in a queue, dashboards need an analyst to build, and by the time the numbers arrive, the campaign has already moved on.
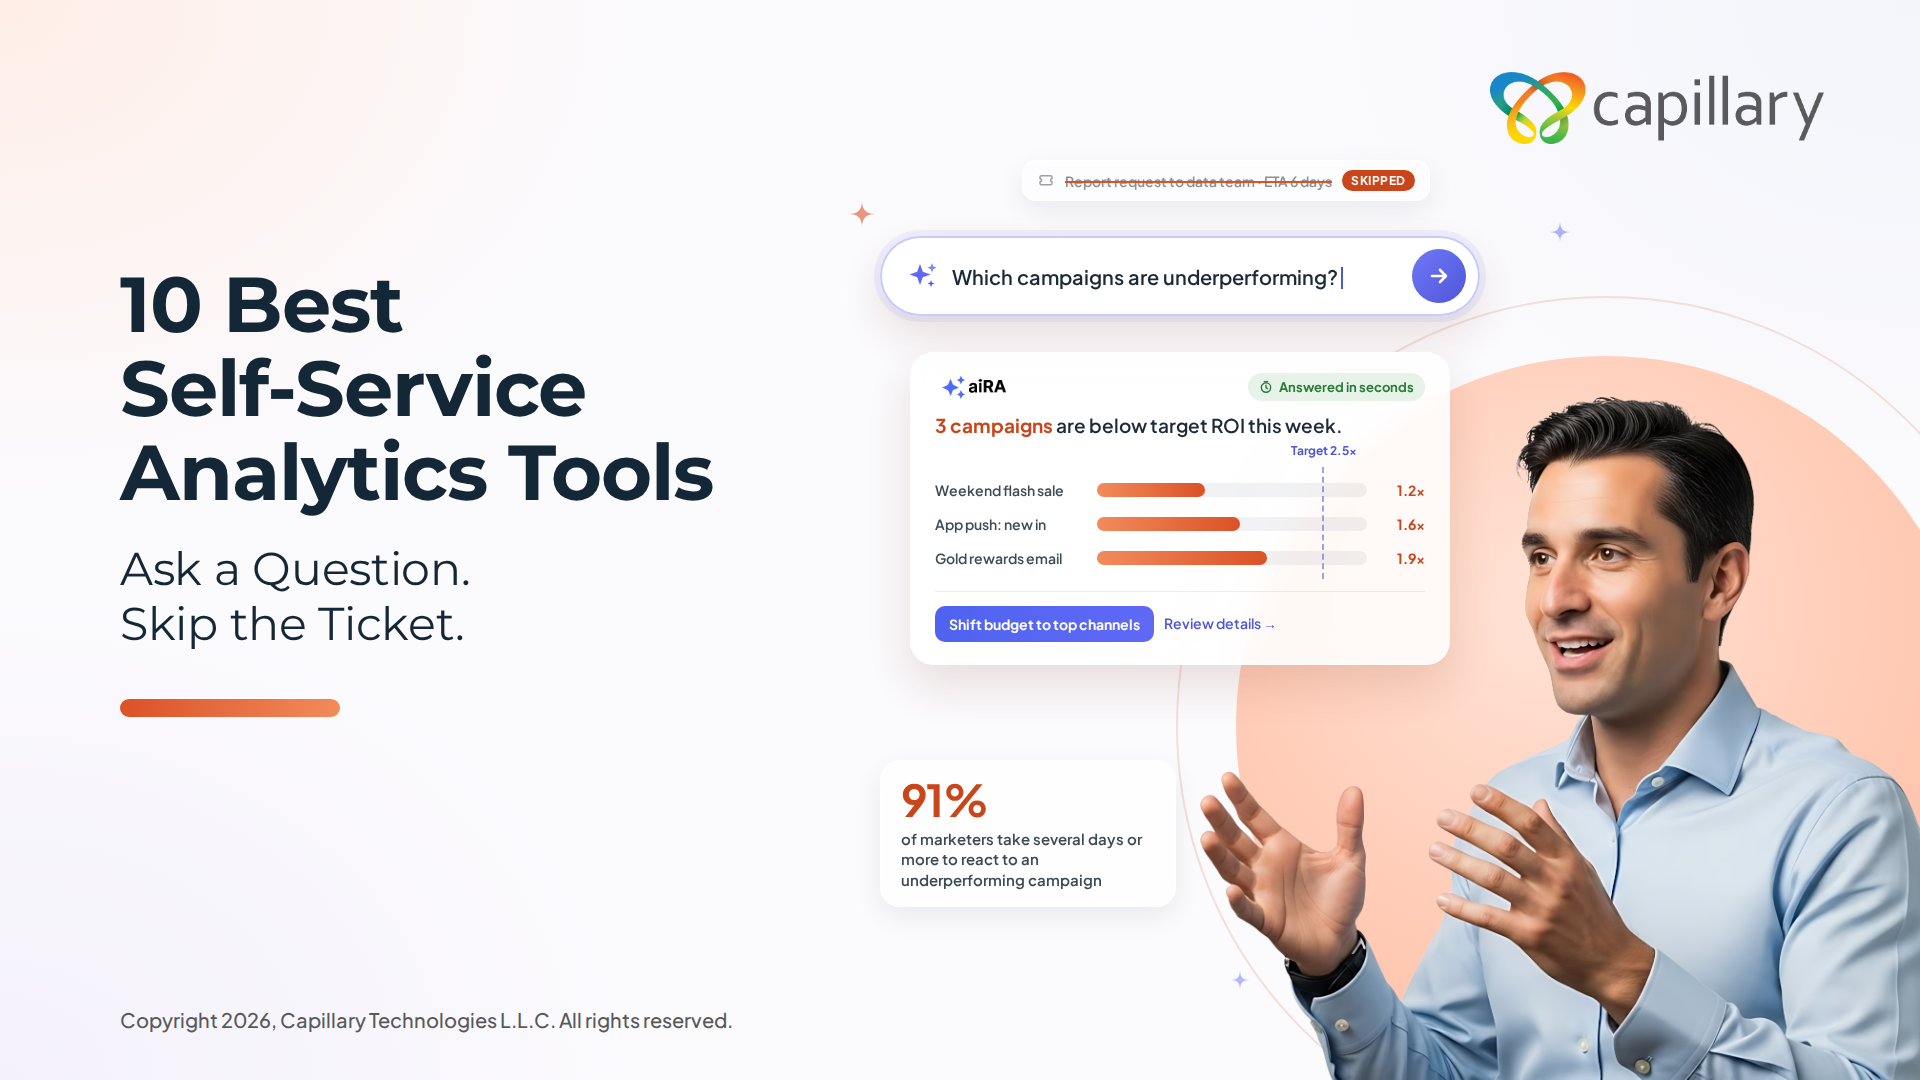
The cost shows up fast. 91% of marketers take at least several days to react to a campaign that’s clearly underperforming, and one in three often wait weeks. If you’re shopping for a self-service analytics tool, that delay is probably why.
Self-service is supposed to fix it: ask a question, get an answer, skip the ticket to the data team. But many tools still need SQL or an analyst, and long reporting times remain marketers’ biggest barrier to acting on insights (33%).
So we compared 10 platforms on what buyers actually need: answers without SQL, numbers you can trust, connections to your marketing data, and the ability to act on what you find. Our top pick is aiRA by Capillary, which handles analysis and campaign execution in one conversational workflow, so there’s no handoff between the question and a live campaign.
aiRA isn’t the right fit for everyone. If you have an analyst-led BI team or mainly need dashboards, a tool further down the list may suit you better. Here’s who each one is for.
A self-service analytics tool is software that lets non-technical people query, visualize, and share data on their own, without waiting on a data engineer or analyst. You ask a question, you get an answer. Self-service analytics software covers the same ground: it’s the layer that sits between your data and the people who need to make decisions with it.
In a traditional BI setup, analysts build the reports and everyone else requests them. That works until the queue gets long, which is usually when you need an answer most. Self-service flips the model: the marketer, the ops lead, or the growth manager explores the data directly, and the data team focuses on keeping the foundation clean instead of answering one-off questions.
It’s also different from embedded analytics. Embedded analytics puts dashboards inside a product for that product’s end users, like the usage reports a SaaS app shows its customers. Self-service analytics is for your own team, working on your own data.
Most self-service analytics tools are built from the same five pieces:
The quality of each piece varies a lot between platforms, which is why two tools that both say “self-service” can feel completely different in practice. One more thing to watch: most tools stop at the dashboard. They tell you what happened, and acting on it is still a separate job. We’ll come back to that gap throughout this guide, because it’s what separates a tool that informs your decisions from one that helps you execute them.
If you’re reading this, you’ve probably felt the pain already: you need a number, you ask for it, and then you wait.
The global self-service analytics market was valued at USD 5.70 billion in 2025 and is projected to reach USD 21.93 billion by 2034, a 16.14% CAGR. That growth reflects a clear shift: organizations are investing in these tools because delays in reporting now carry a real cost.
And the problem usually isn’t a lack of data, 53% of marketers say they don’t consistently turn data insights into campaign action. The numbers are there. They just show up late, sit in the wrong tool, or need someone else to explain them first.
Here’s what that looks like day to day:
None of these fix themselves, and they get pricier the longer they go on. The faster your team can get its own answers, the faster they stop.
Most comparison guides in this space rank tools by feature count: more integrations, more dashboards, more AI badges. That tells you what a tool can technically do. It doesn’t tell you whether your team will get answers faster, and that’s the only thing that should drive a purchase.
So we scored each platform on four questions a marketing or business buyer actually cares about.
Every platform was scored across all four, not ranked on one standout feature. A tool with deep reporting but no way to act serves a different buyer than one with lighter reporting that can launch a campaign from a prompt. Both have a place. The right pick depends on which part of the process is slowing your team down.
Here’s the quick view before we get into each tool. The last column is the one to watch, since it shows which platforms stop at the answer and which can help you act on it.
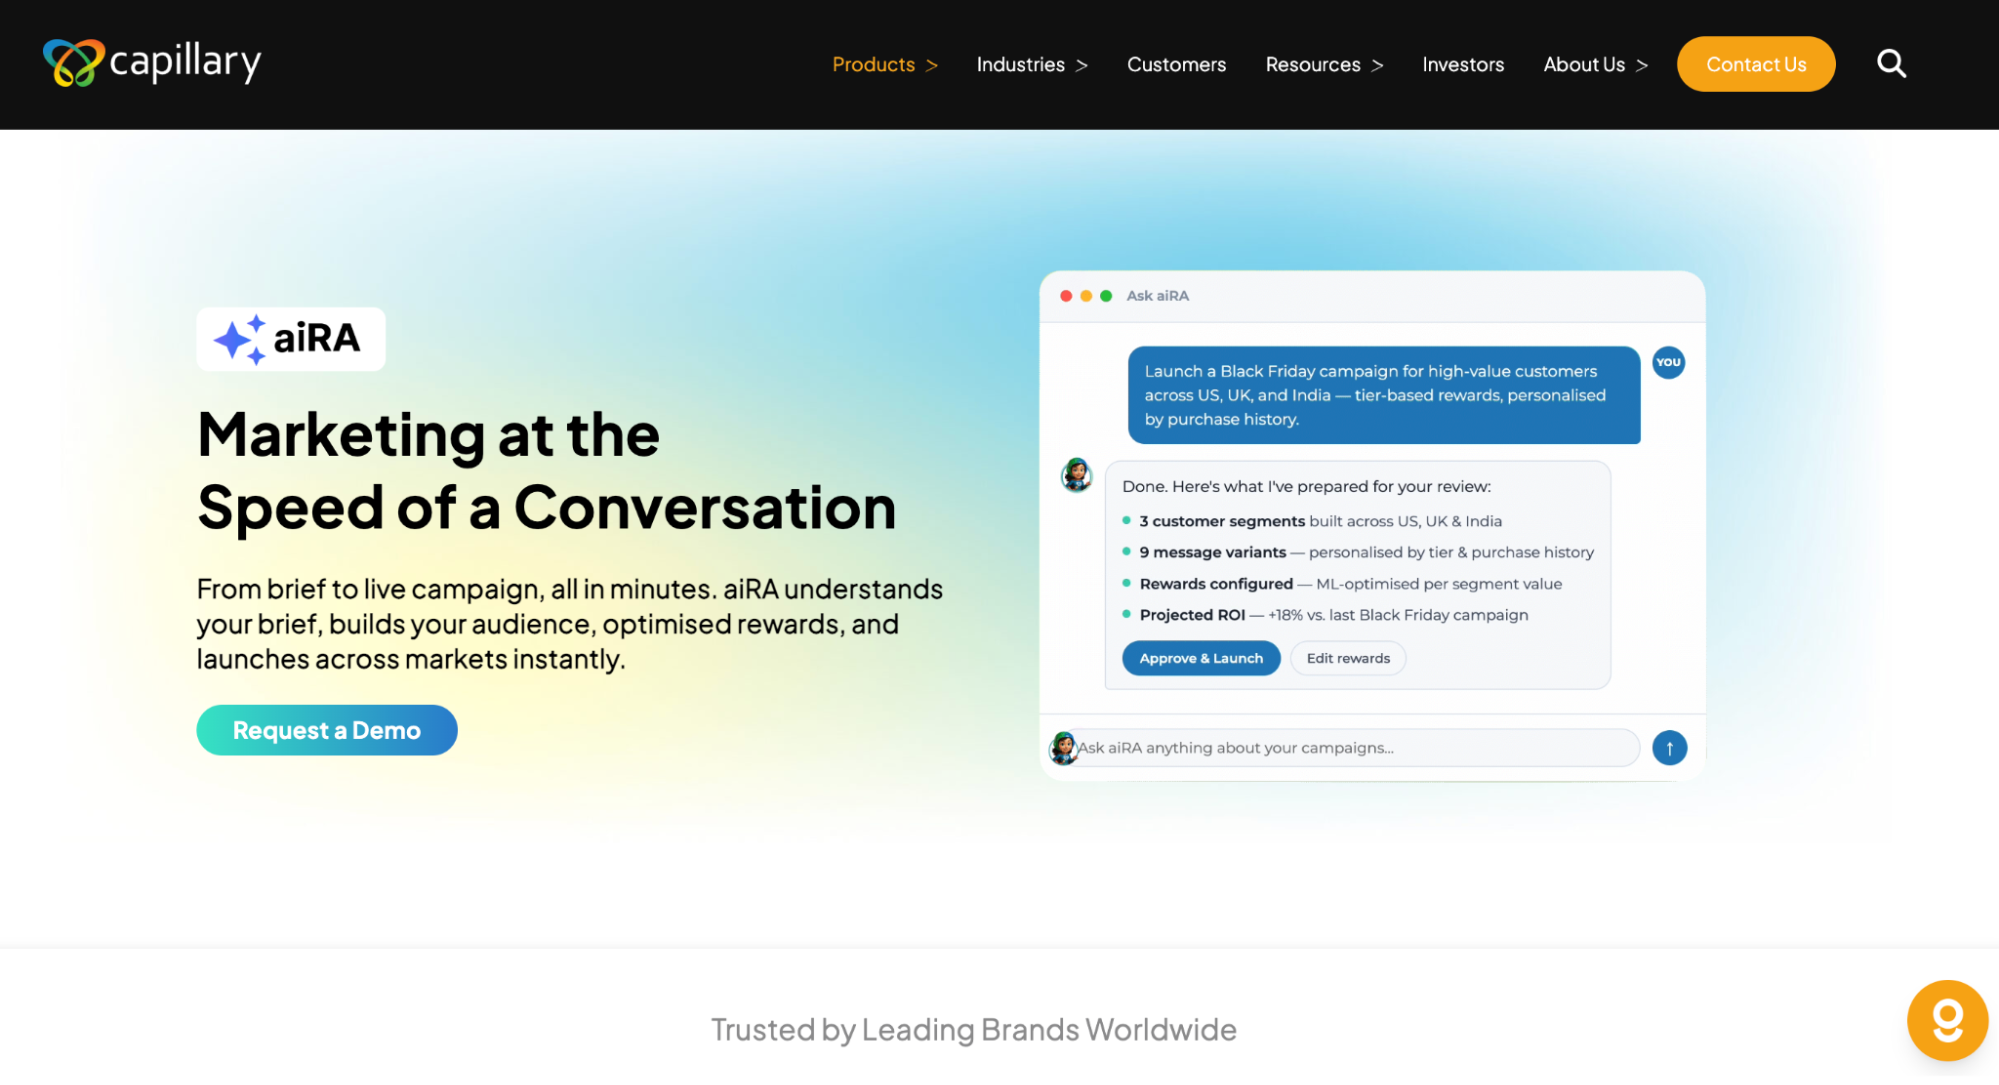
aiRA by Capillary is Capillary Technologies’ agentic AI marketing and loyalty co-pilot. It brings segmentation, reward optimization, campaign creation, and performance analytics into one conversational interface, so your team isn’t hopping between tools to get from a question to a live campaign.
Here’s what sets it apart from the rest of this list. With most self-service tools, you ask a question, get a chart, and then someone has to go build the campaign somewhere else. With aiRA, asking and acting happen in the same workflow, with human approval at each step, so your team stays in control of what goes live.
The results back that up:
Key features
Honest limitations
Pricing: Custom, quote-based.
Who it’s for: aiRA by Capillary is a strong fit for marketers who want analysis and execution in one place and are tired of the handoff between insight and action. If your team mainly needs generic BI dashboards across finance and operations, one of the tools further down this list will likely suit you better.
Want to see how this works with your own data? Book an aiRA demo and walk through a live campaign build.
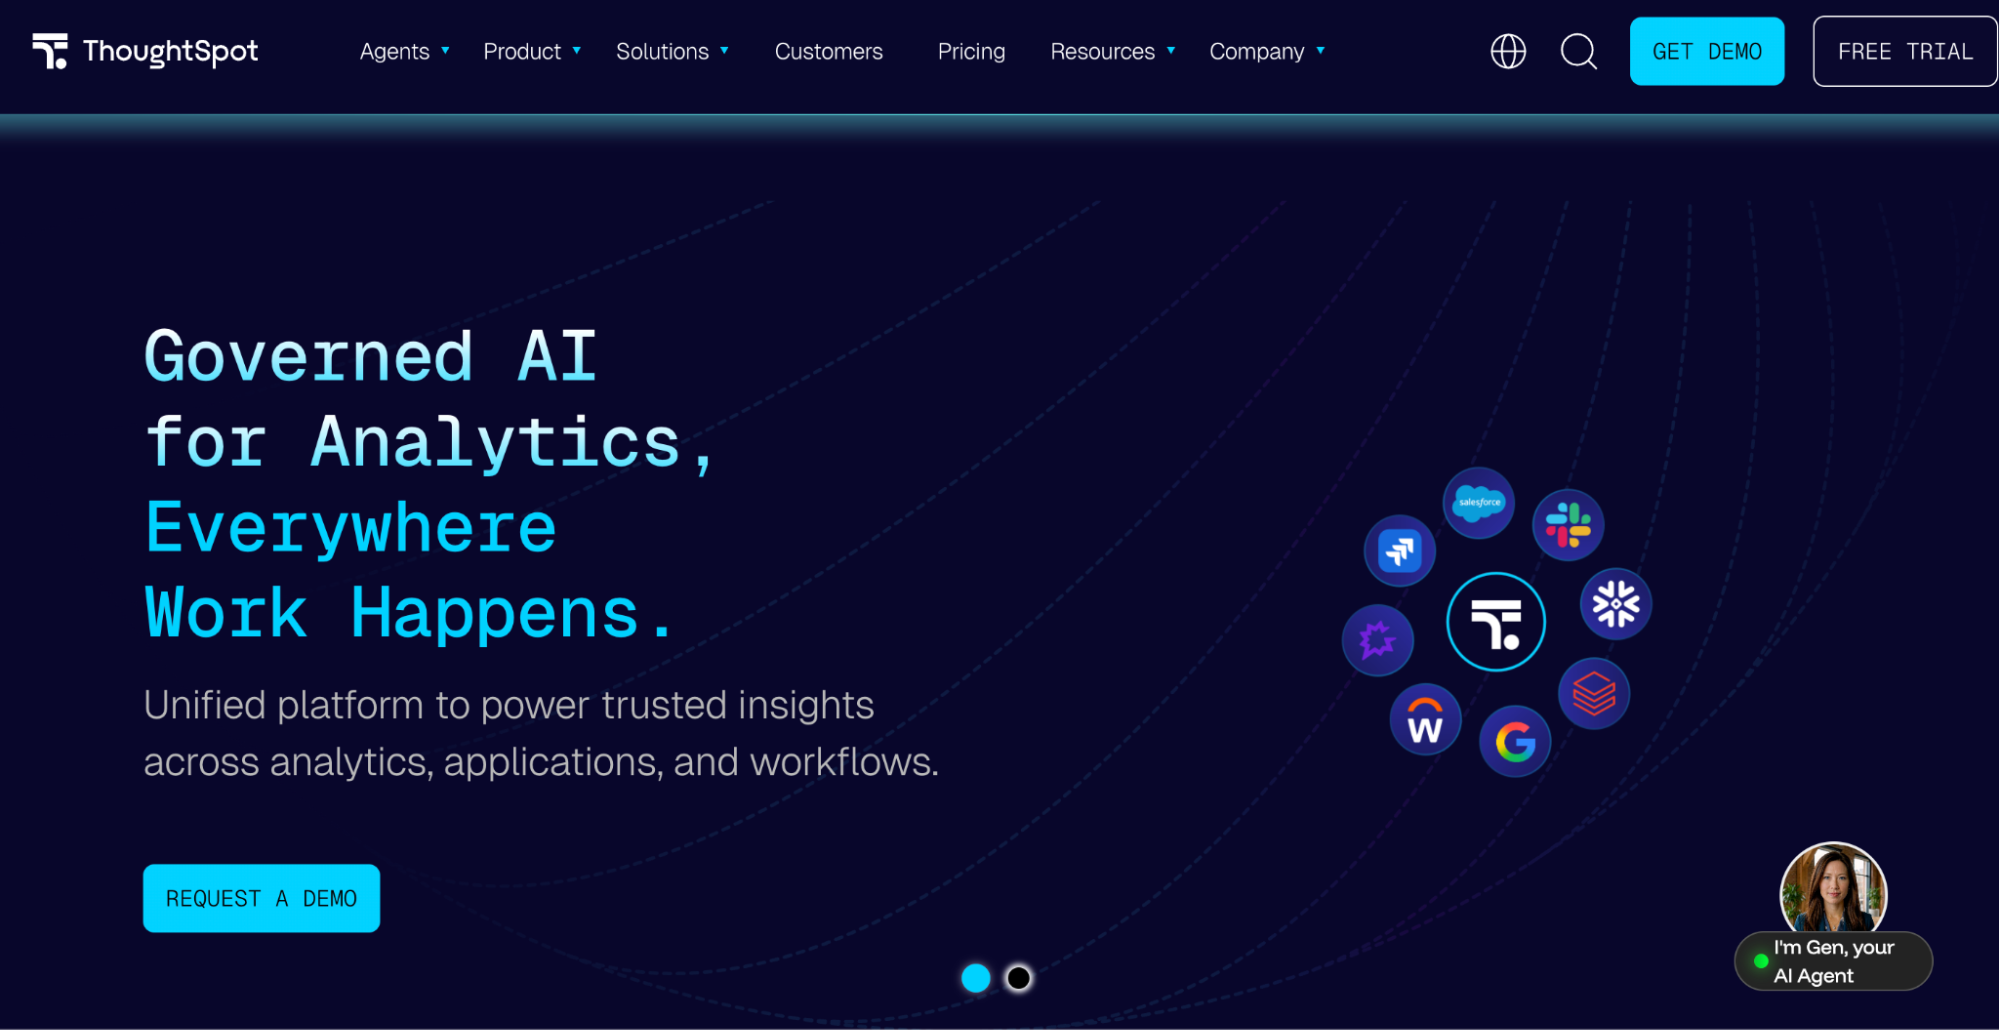
ThoughtSpot is built around a simple idea: you should be able to ask your data a question the way you’d ask a colleague. Its search-based interface and Spotter AI assistant let business users type a plain-English question and get an answer, without writing SQL or waiting on a report.
The catch is in the setup. ThoughtSpot works best when your data has already been modeled, so a data team usually needs to do the groundwork before business users can start asking questions. Once that’s in place, it’s one of the more approachable options for non-technical teams.
Key features
Honest limitations
Pricing: ThoughtSpot publishes per-user tiers. Essentials starts at $25 per user per month and Pro at $50, billed annually, with Enterprise on custom quotes. Watch the limits as you scale: Essentials tops out at 25 million rows and 50 users, and Pro at 250 million rows. Before you commit, check which tier includes the AI agent and how much usage it allows.
Who it’s for: ThoughtSpot is a strong fit for non-technical teams who want to ask plain-English questions on well-modeled data, and have a data team to set that up. If you want your marketers to go from a question to a live campaign without leaving the tool, or you don’t have data resources to spare for modeling, it’s less of a match.
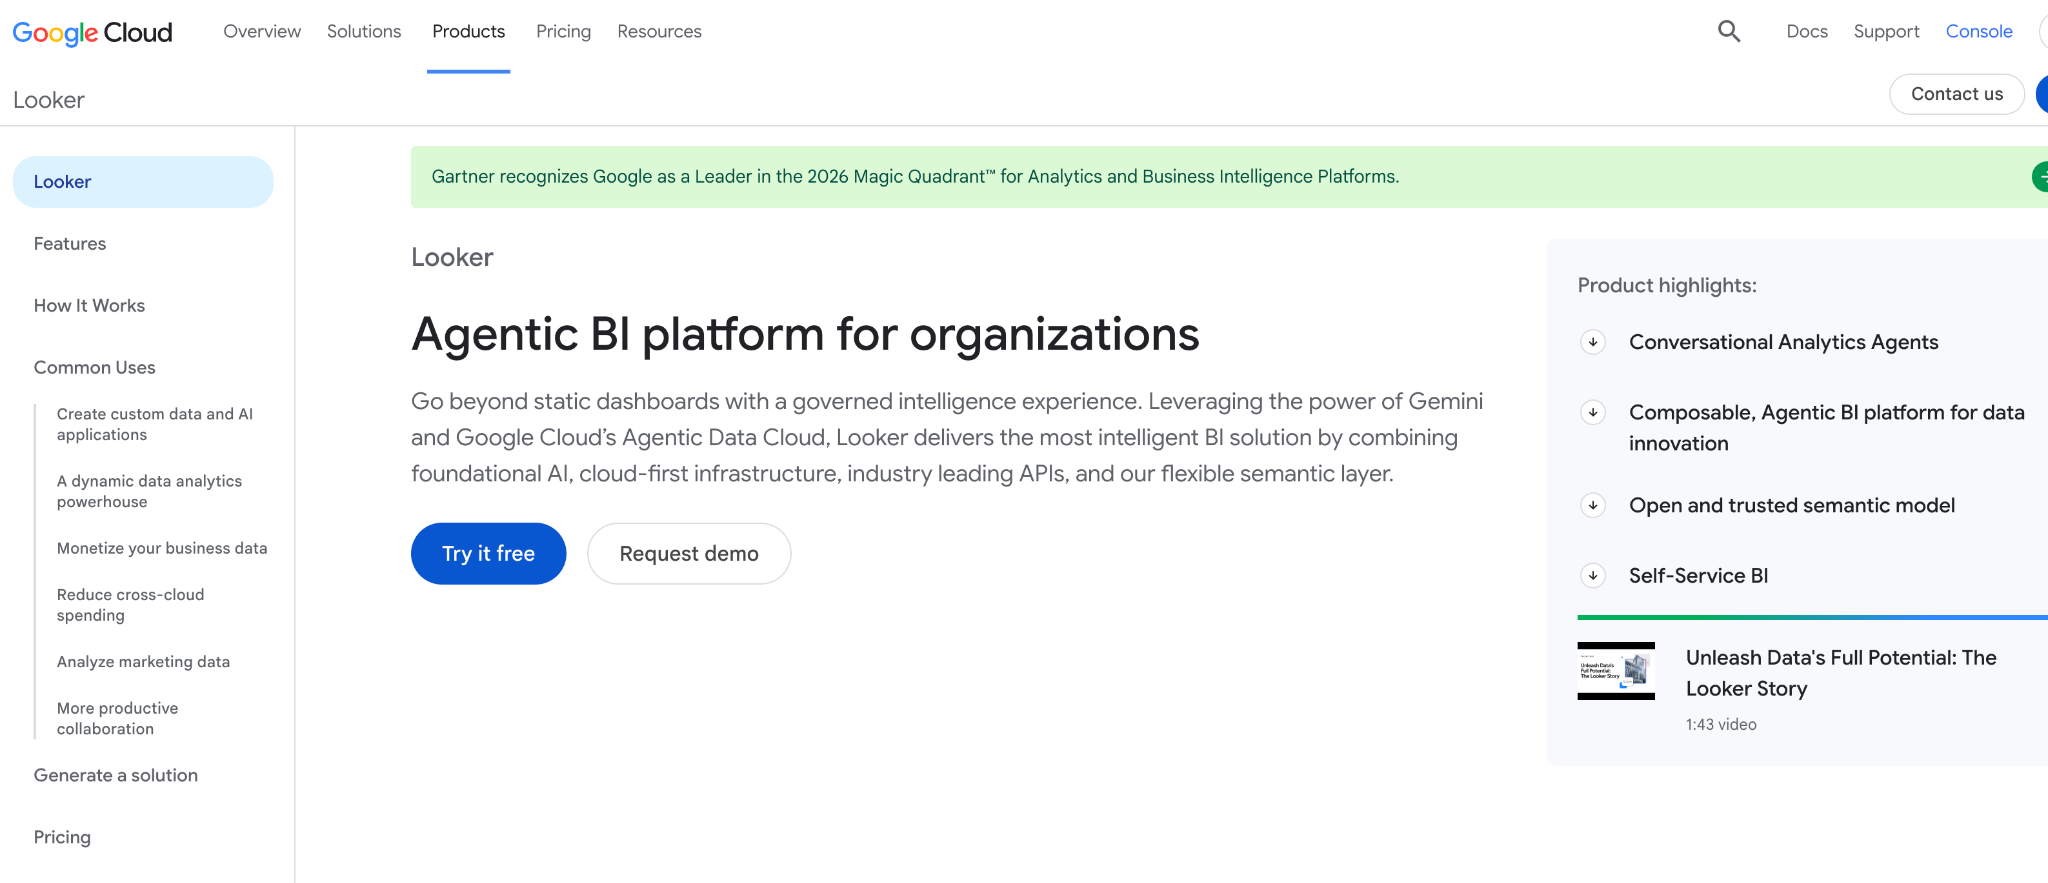
Looker is Google Cloud’s enterprise BI platform, and its big selling point is consistency. Metrics are defined once in a central semantic layer called LookML, so when the CFO and the head of marketing both pull “revenue,” they get the same number. If your teams have ever lost a meeting to the question of whose spreadsheet is right, you’ll see the appeal.
Business users can then explore that governed data on their own, including through Gemini, Looker’s AI assistant. The tradeoff is that someone has to build and maintain the model first, which makes Looker more of a data-team project than a pick-it-up-and-go tool.
Key features
Honest limitations
Pricing: Custom, quote-based.
Who it’s for: Looker is a strong fit for enterprises that need governed, consistent metrics across teams and have the data resources to model them. If your marketers want to move quickly without waiting on a data team, or you want to act on an insight in the same place you found it, it’s likely more tool than you need.
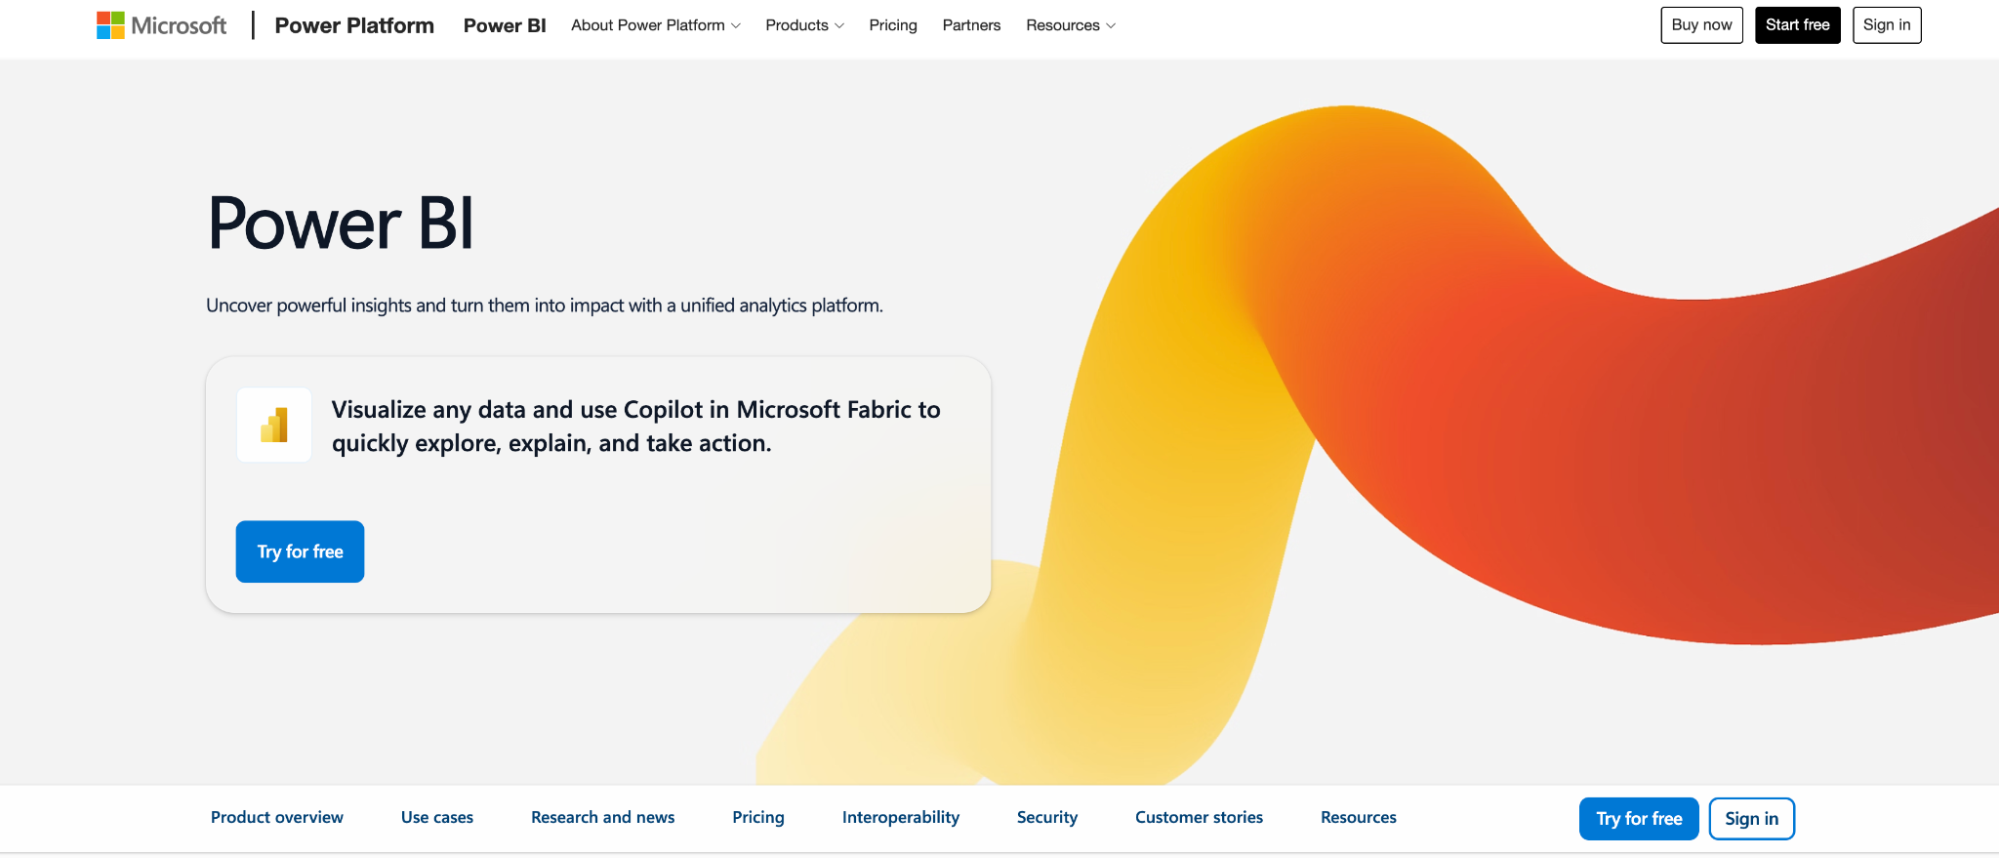
Power BI is Microsoft’s BI tool, and its biggest advantage is that it fits neatly into the Microsoft world. If your team already lives in Excel, Teams, and Azure, Power BI feels familiar from day one, and getting data in and reports out takes less effort than with most alternatives.
It’s also a capable tool well beyond marketing. Finance, operations, and sales can all report from the same place, which is a real plus for organizations that want one BI platform across the business. In most setups, though, analysts build the reports and business users mostly view them.
Key features
Honest limitations
Pricing: Per-user licensing keeps entry costs low. Pro is $14 per user per month and Premium Per User is $24, with Fabric capacity pricing for larger rollouts. Costs can climb quickly once you factor in capacity and AI features, so it’s worth mapping out your license mix before you commit.
Who it’s for: Power BI is a strong fit for teams already in the Microsoft ecosystem that want a cost-effective BI tool across departments and have analysts to build the reports. If your marketers want to go from question to live campaign without a separate build step, or your stack lives outside Microsoft, you’ll probably be happier with another option.
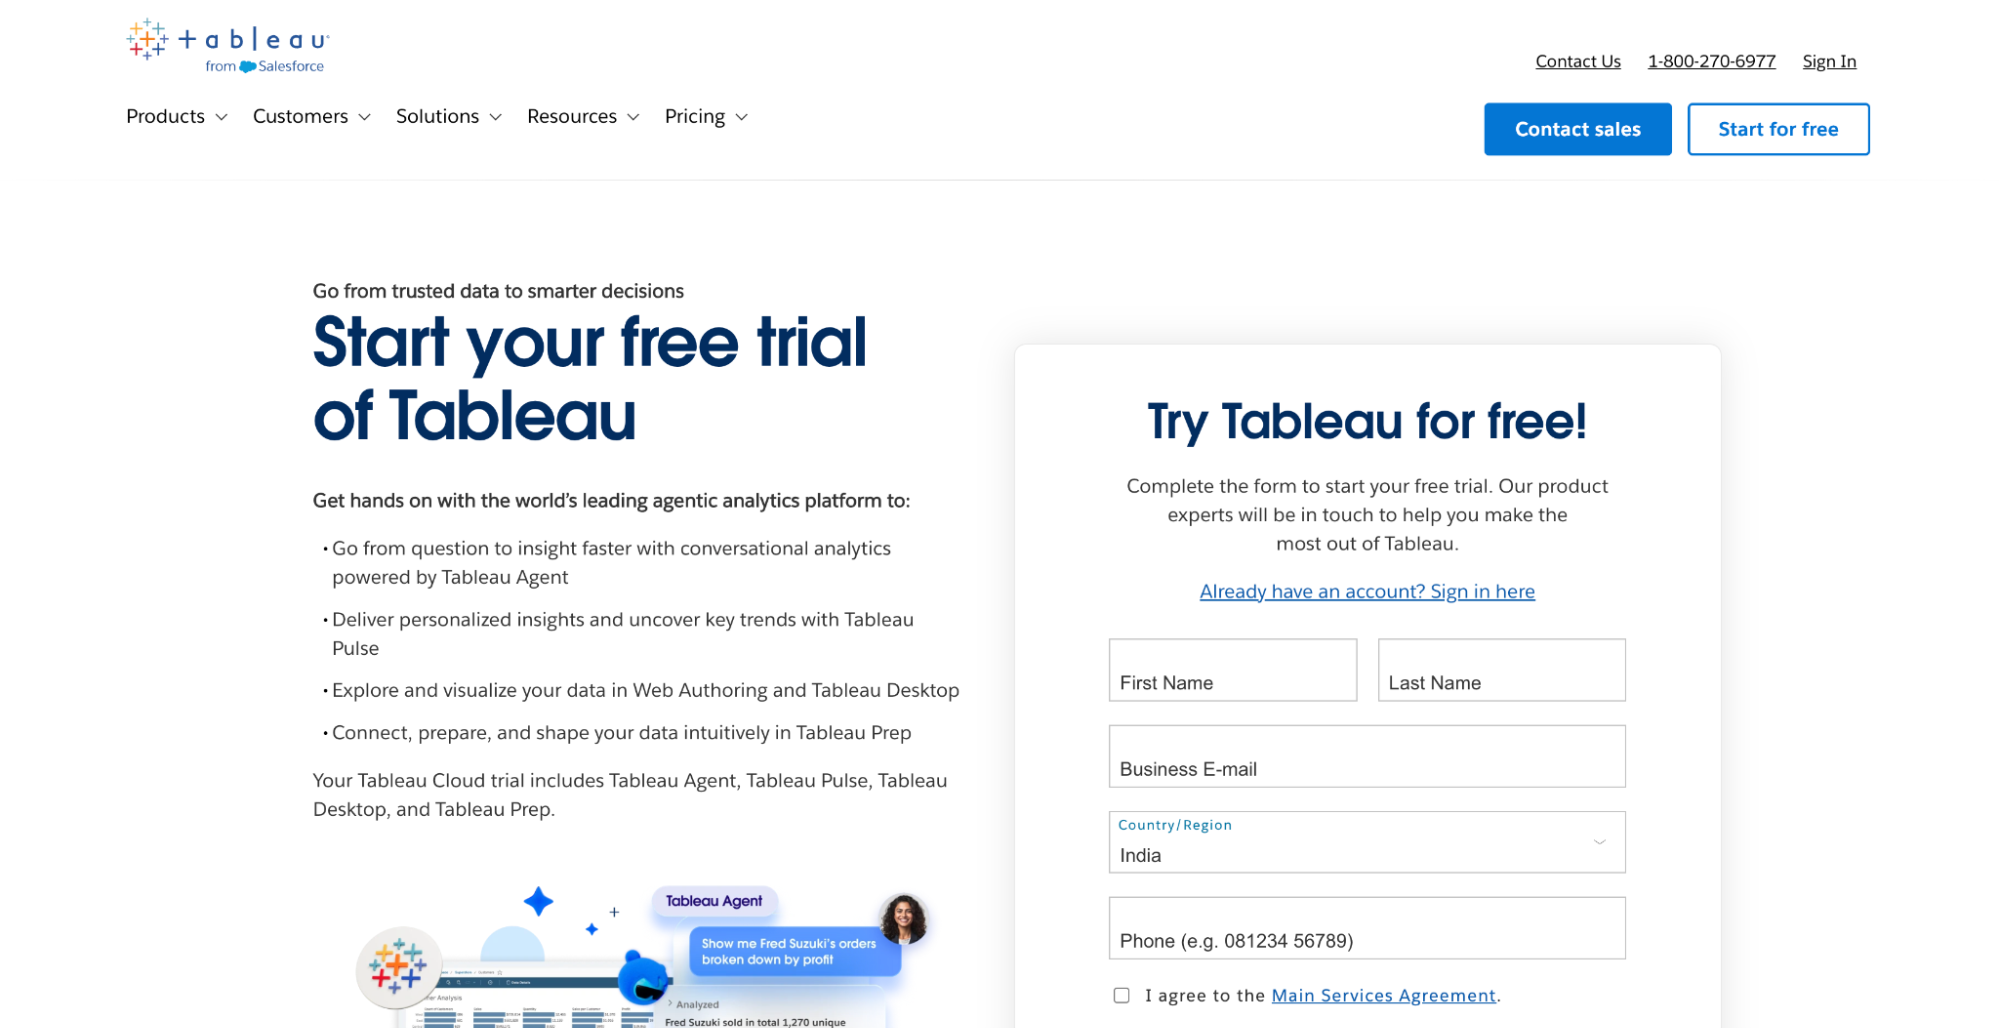
Tableau is the tool a lot of analysts reach for when the visualization itself matters. It’s known for flexible, polished dashboards and a level of control over how data is explored and presented that’s hard to match. Now part of Salesforce, it also connects well with the Salesforce ecosystem.
That depth comes with a catch for self-service. Tableau is analyst-led: skilled people build the dashboards, and most business users interact with what’s already been built. Newer AI features like Pulse and Tableau Agent make it easier for non-technical users to ask questions, but the heavy lifting still sits with your analysts.
Key features
Honest limitations
Pricing: Role-based, per user, billed annually. On the Standard edition, Creator is $75 per user per month, Explorer $42, and Viewer $15, with Enterprise tiers priced higher. Watch the add-ons, because Tableau Agent and premium Pulse features can push costs up.
Who it’s for: Tableau is a strong fit for analyst-led teams that want deep, flexible visualization and have the people to build and maintain it. If your marketers want to ask a question and get an answer without waiting on an analyst, or you want to launch a campaign from the same place you found the insight, it’s a better fit as a reporting layer than a complete solution.
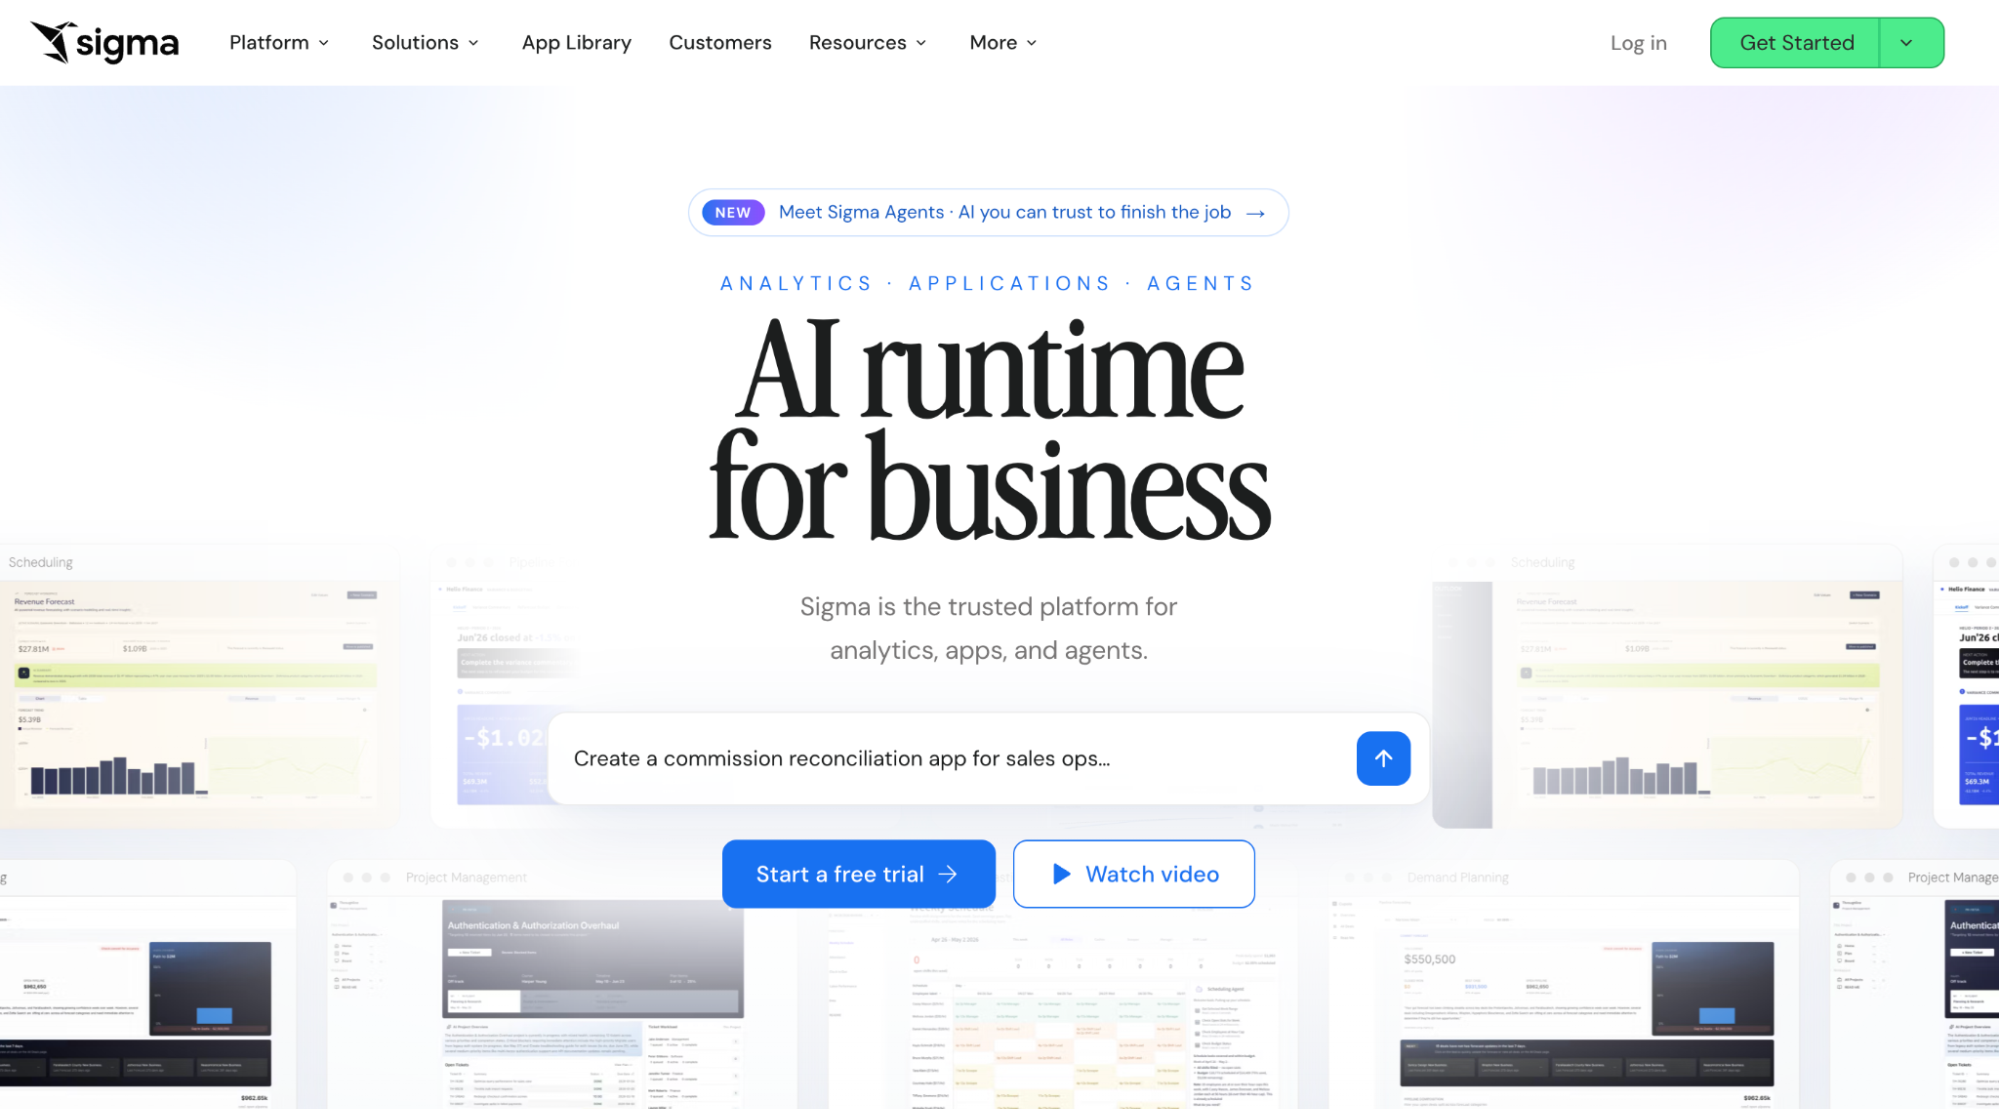
Sigma takes a different angle on self-service. Instead of asking business users to learn a new BI interface, it gives them one they already know: a spreadsheet. Rows, columns, pivot tables, and formulas, but running live on your cloud data warehouse, so nobody is exporting CSVs or working from stale copies.
For teams that think in spreadsheets, that’s a big shortcut. It also goes a step beyond most BI tools with write-back, which lets users enter data, like forecasts or budget assumptions, and push it back to the warehouse.
Key features
Honest limitations
Pricing: Not published. Sigma is contact-sales only, with pricing based on user licenses across functionality tiers, so you’ll need a quote. A free trial is available.
Who it’s for: Sigma is a strong fit for spreadsheet-first teams, like finance, ops, and analytics-minded marketers, who want to work on live warehouse data without learning a traditional BI tool. If you need to go from insight to a live campaign in the same place, or you don’t have a cloud data warehouse yet, it’s not the right match.
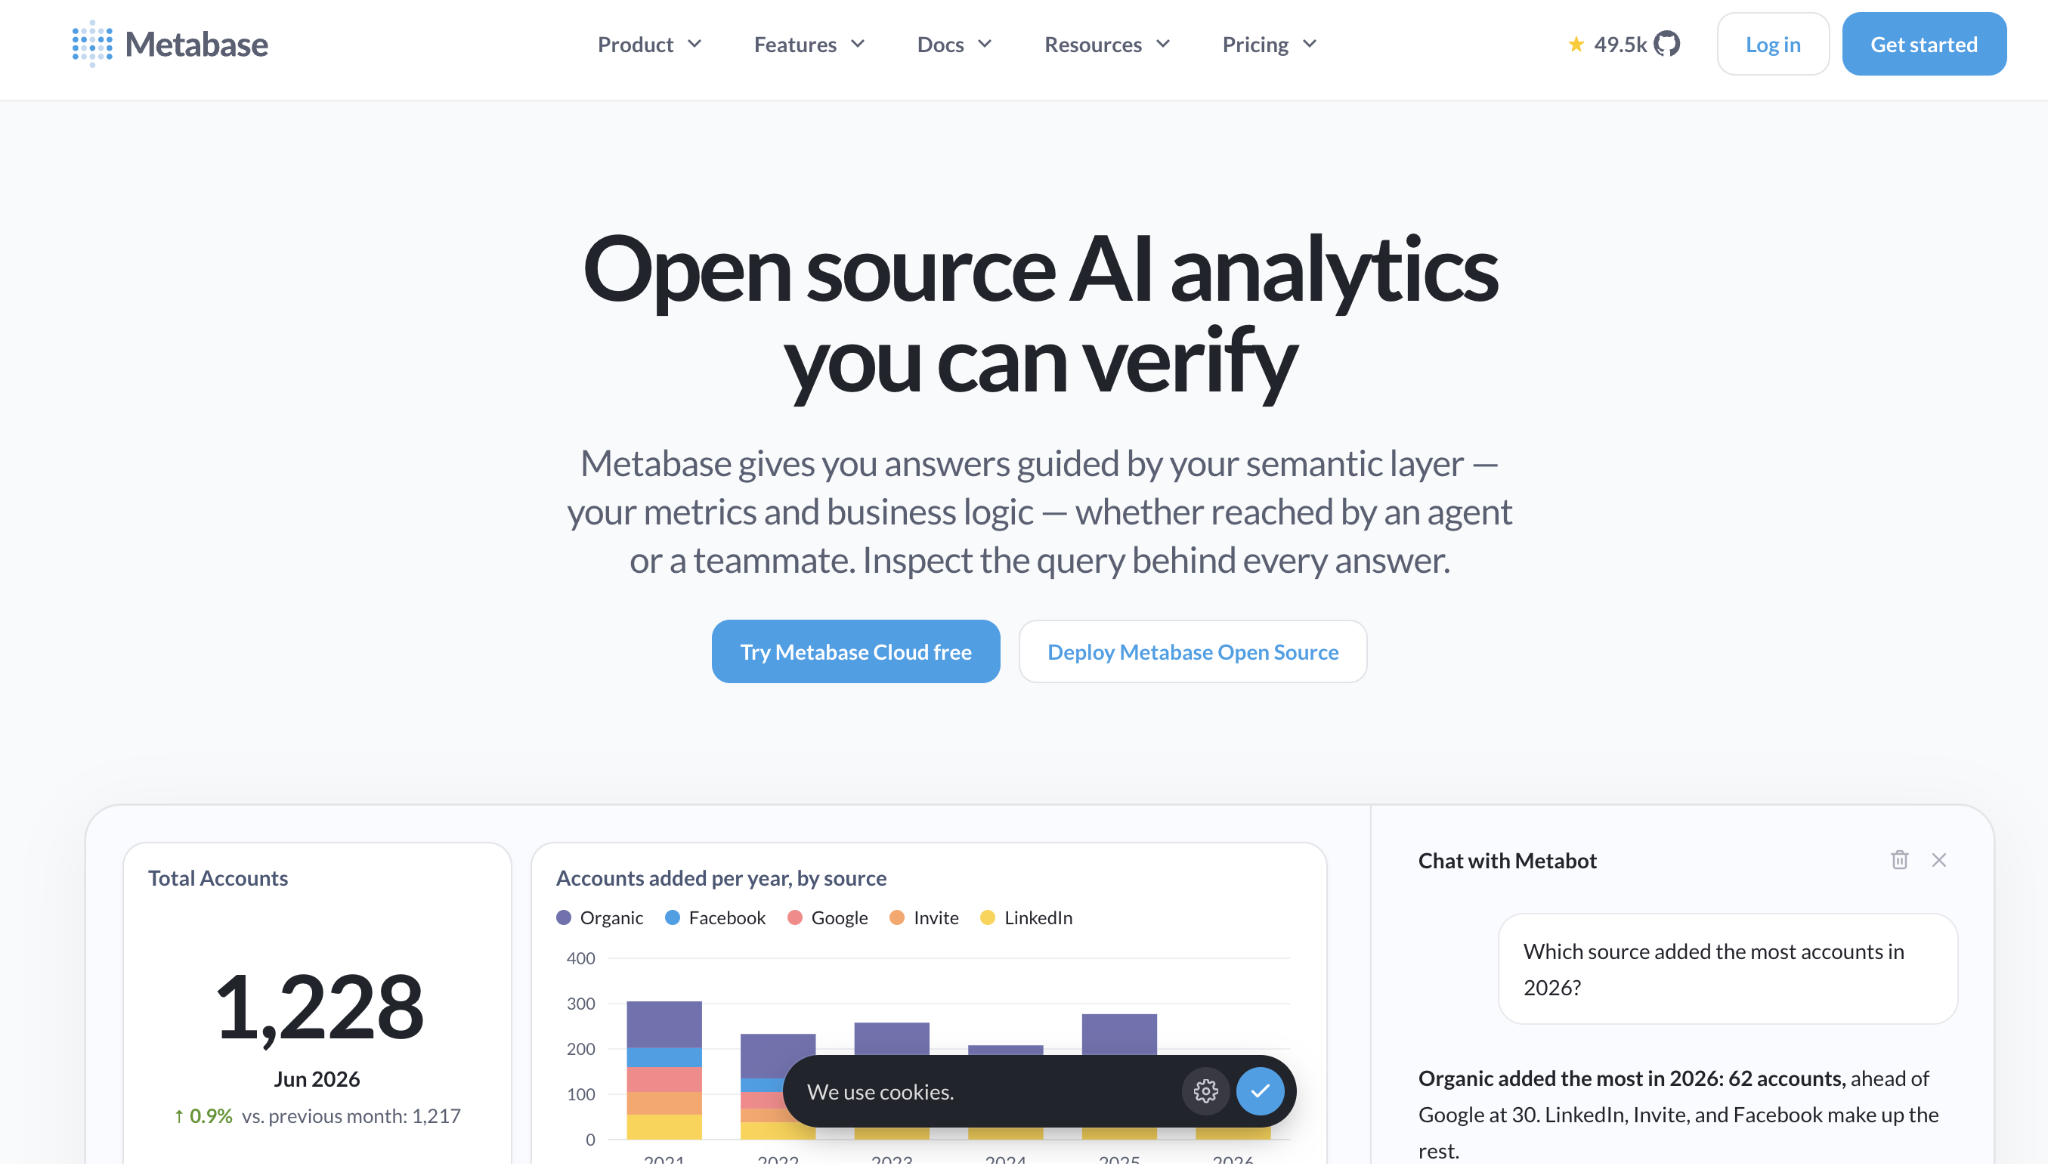
Metabase is the friendly, no-nonsense option. It’s open source, quick to get running, and built so that people who don’t write SQL can still ask questions of their data through a point-and-click interface. Analysts can drop into SQL when they need to, so one tool serves both groups.
That mix of low cost and low friction is why startups and smaller teams love it. The flip side is that it’s a general-purpose BI tool. It connects to your databases and warehouses, so marketing data from ad platforms and your CRM needs to land there first.
Key features
Honest limitations
Pricing: Starts at zero, with the open-source edition free to self-host. On the cloud side, Starter is $100 per month and Pro is $575 per month, with per-user fees on top, and Enterprise starts around $20,000 per year. Optional extras like Metabot AI can add to the bill, so check what your plan includes.
Who it’s for: Metabase is a strong fit for startups and smaller teams that want fast, affordable self-service analytics and have someone who can set up the data connections. If you need governed metrics at enterprise scale, or you want your marketers to go from a question to a live campaign without leaving the tool, you’ll outgrow it quickly.
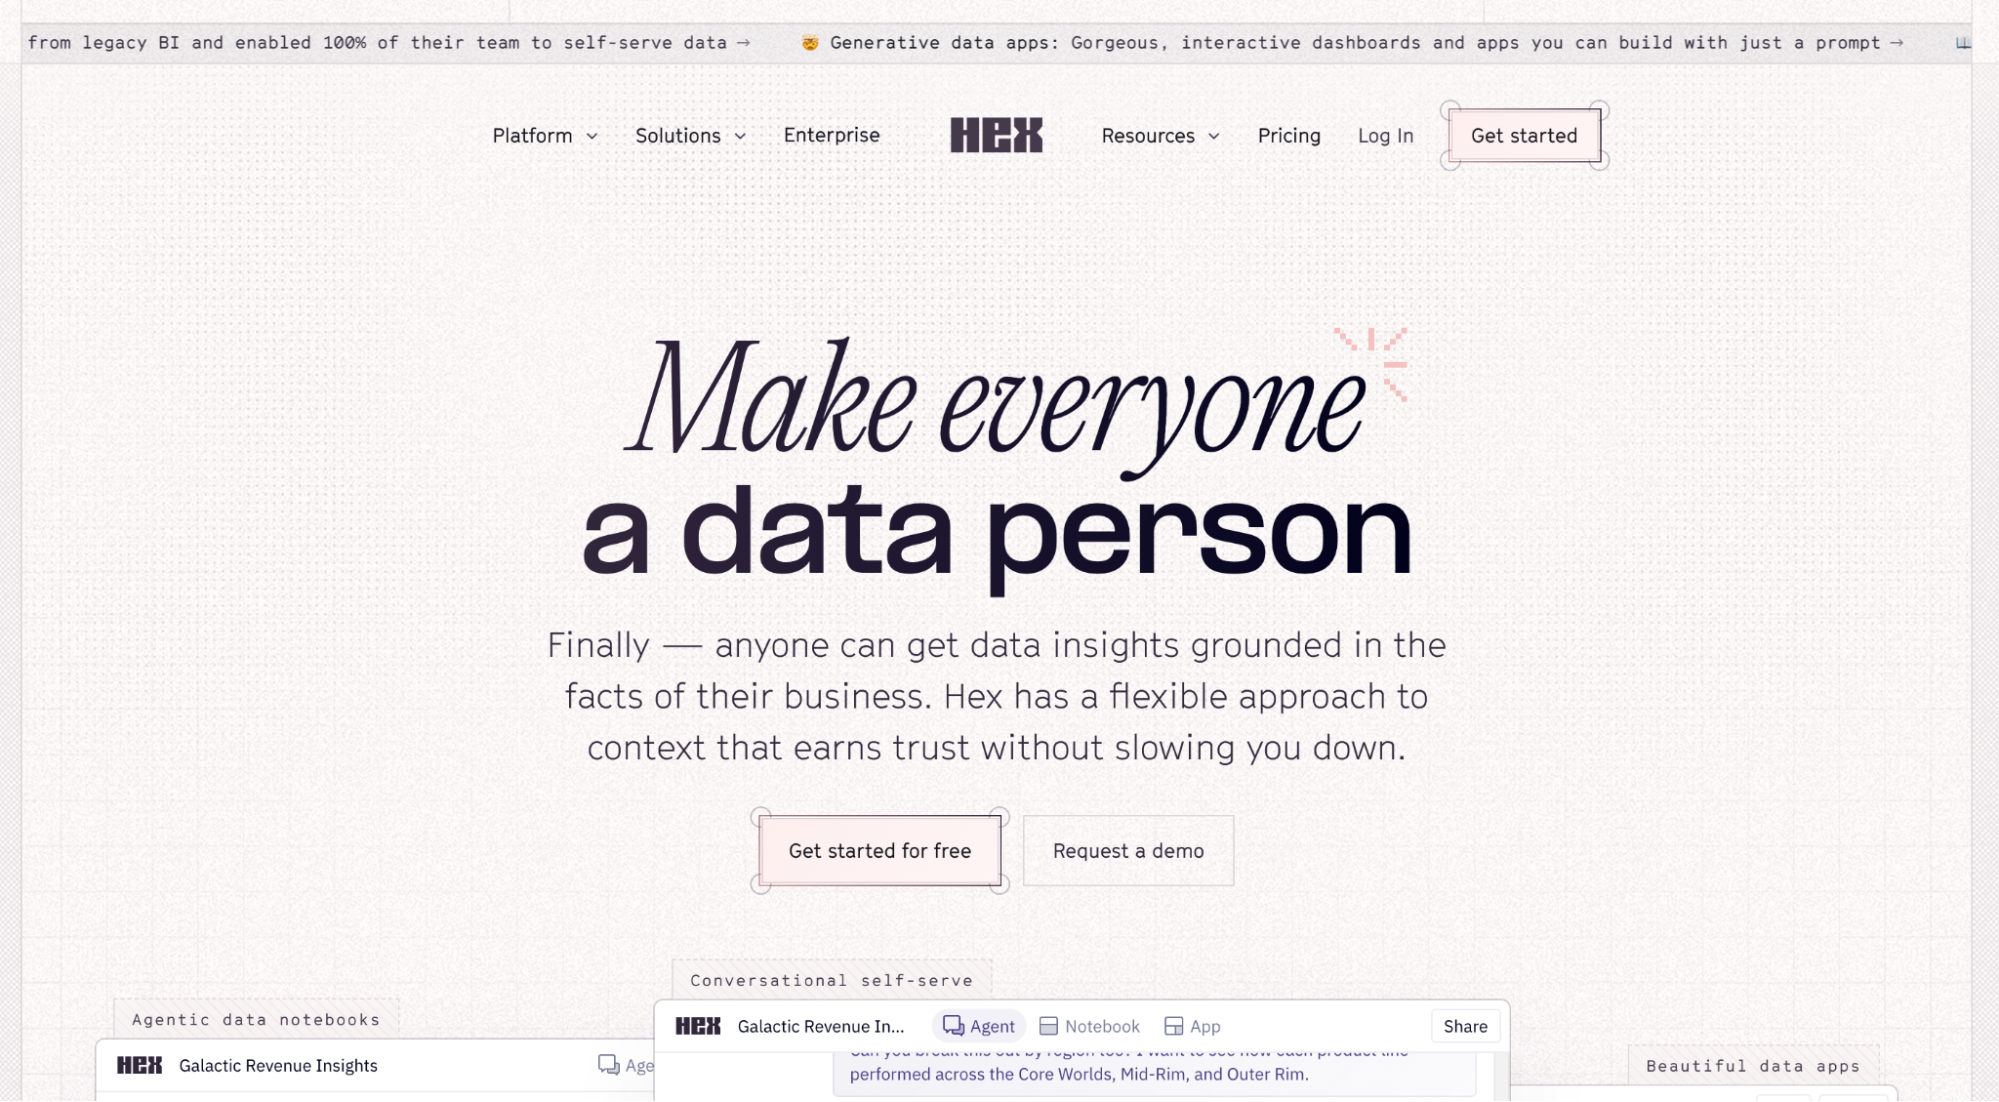
Hex is built for data teams first. It’s a collaborative workspace where analysts write SQL and Python in shared notebooks, with an AI agent that helps write and run the analysis alongside them. When the work is ready, they publish it as an interactive app or dashboard that the rest of the company can use.
Business users get in through Threads, Hex’s conversational interface, where they can ask questions in plain English against data the team has set up. So Hex does serve non-technical people, but the platform is shaped around the people who build things for them.
Key features
Honest limitations
Pricing: Pricing is published and priced per editor seat. Community is free, Professional is $36 per editor per month, and Team is $75, with Enterprise on custom quotes. Keep in mind that editor seats, compute, and AI usage are the three cost layers that can push total spend above the base price.
Who it’s for: Hex is a strong fit for data teams that want notebooks and AI in one place, and want to give the rest of the company a friendlier way to explore their work. If your marketers need to run their own analysis and launch campaigns without leaning on a data team, it’s more of a data team tool than a marketer tool.
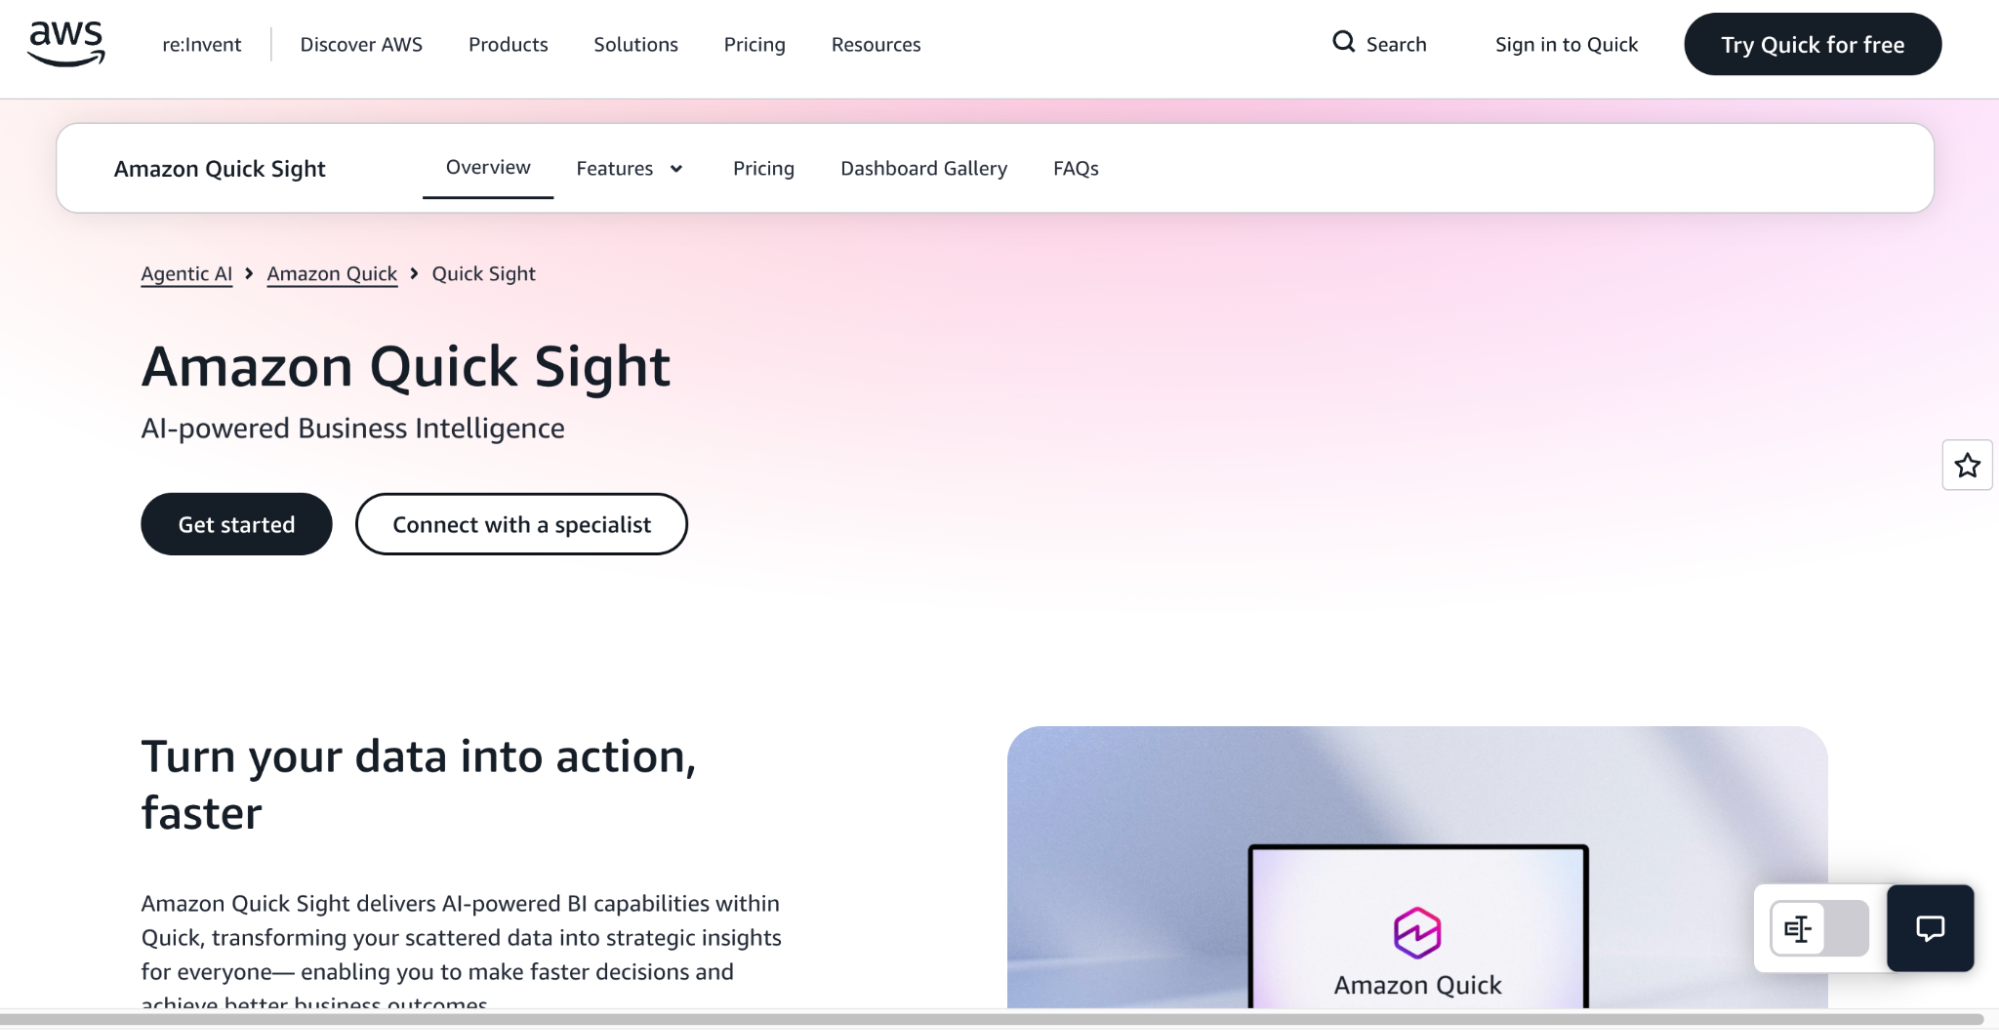
Amazon QuickSight is AWS’s BI service, now branded Quick Sight and part of Amazon Quick Suite. If your data already lives in AWS, it’s a natural fit: it connects directly to sources like Redshift, Athena, S3, and RDS, runs without servers to manage, and scales as your user base grows.
Natural language questions come through Amazon Q, where authors set up Q Topics on specific datasets so business users can ask questions in plain English. Higher tiers add generative AI extras, like executive dashboard summaries and data stories.
Key features
Honest limitations
Pricing: Per-user and usage-based. Readers start at around $3 per user per month and Authors at around $24, while Pro tiers with generative AI features cost more, such as Reader Pro at about $20. An account-level fee can also apply when Pro users have Q&A enabled, so confirm the current numbers on the AWS pricing page before you budget.
Who it’s for: QuickSight is a strong fit for AWS-native teams that want a cost-conscious, scalable BI layer next to the data they already have in AWS. If your stack lives elsewhere, or you want your marketers to go from a question to a live campaign without leaving the tool, you’ll likely want a different option.
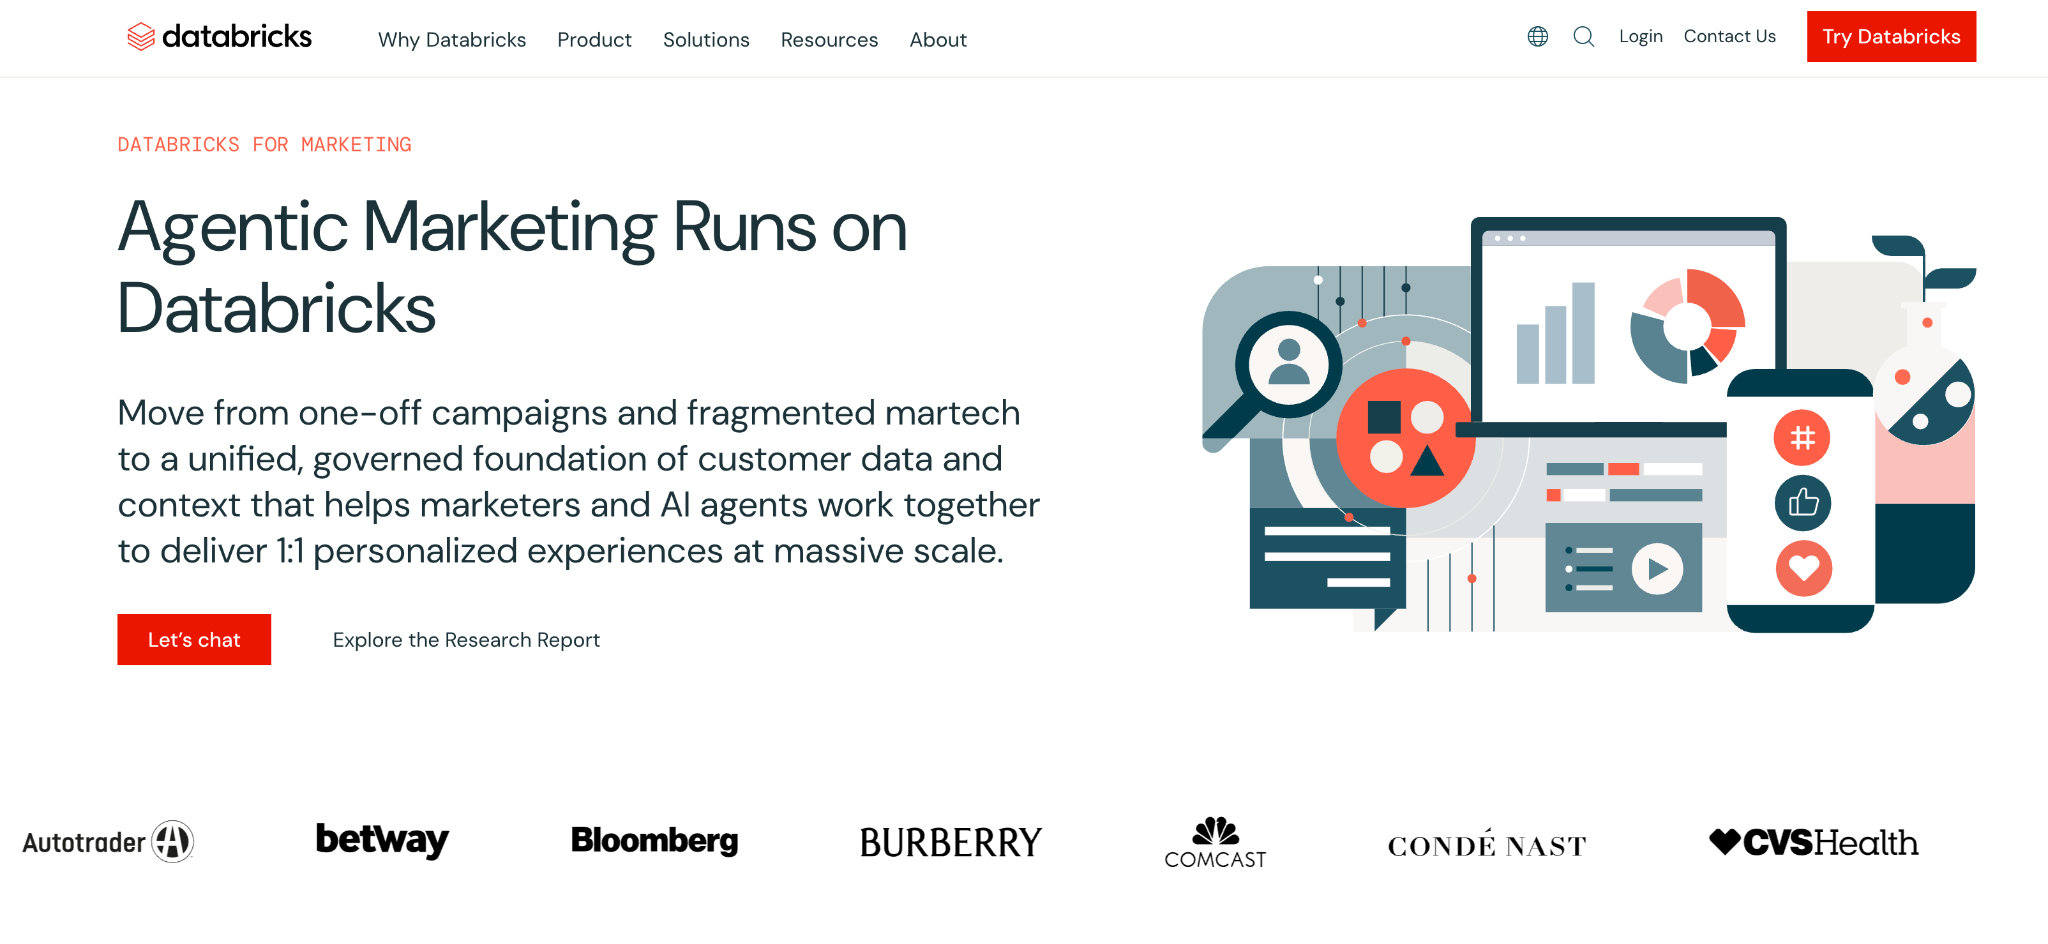
Databricks is less a BI tool and more a full data platform. Its lakehouse approach puts data engineering, analytics, and AI on one governed foundation, and BI sits on top of that. For companies that already run their data on Databricks, that’s a big draw, because analytics happens right where the data lives.
For self-service, Genie is the piece that matters. It lets business users ask questions of governed data in plain English, and Databricks One gives them a simpler front door to it. Behind that, though, data engineers and analysts do the heavy lifting of building and maintaining what business users see.
Key features
Honest limitations
Pricing: Consumption-based, billed in Databricks Units (DBUs) and quoted by sales. Genie is now metered too: Databricks began charging for Genie usage beyond a free monthly allowance on July 6, 2026, and the SQL warehouse compute that runs each query is billed separately. For a sense of the rate structure, third-party trackers list rates that vary by workload type.
Who it’s for: Databricks is a strong fit for enterprises with in-house data engineers that want one platform for data, analytics, and AI, with natural language access layered on top. If you’re a marketing team that wants answers and actions without a data engineering project behind them, it’s a heavier lift than you need.
A vendor demo is built to show you what the platform does well. It won’t volunteer what it doesn’t do. These questions help you close that gap before you sign anything, so bring them along and ask them out loud.
One question matters more than the rest, so make it the one you lead with: does this tool need a separate step to turn an insight into a live campaign, or can it launch one on its own? Most platforms on this list will answer the first five questions well. Very few can say yes to this one, and that single answer will tell you more about fit than anything else in the demo.
Self-service analytics has moved past the question of whether you can ask a data question without writing SQL. Most tools on this list can do that now. The real question is what happens after you get the answer.
That’s where the list separates. Most platforms handle the early checklist items well: integrations, usability, governance, pricing. And those basics matter. Organizations that get real value from analytics and AI tend to invest in trustworthy data, governance, and security first. Get those wrong and no tool will save you.
But even with a solid foundation, there’s a handoff most teams have learned to live with. A tool tells you which segment to target or which campaign is slipping. Then someone builds the campaign, routes it for approval, and pushes it live in another system, on another timeline. That handoff is where speed dies, and it’s the step most comparison guides never ask about, because a feature list doesn’t capture it.
That’s the gap aiRA by Capillary was built to close. Instead of ending at the insight, it moves from a plain-language question to a live campaign in the same workflow, with your team approving each step. In a Ramadan campaign for a fashion retailer in Saudi Arabia, aiRA outperformed a dedicated analytics agency on 8 of 9 measured KPIs, a strong sign that closing the loop between insight and action beats the traditional handoff.
Every extra day your team spends waiting on a dashboard is another day campaigns run on stale data. If you’re choosing a self-service analytics tool this quarter, pick one that doesn’t stop at the answer.
See what aiRA can do for your marketing team. [Book a demo call]
What is the best self-service analytics tool for marketers?
It depends on what slows your team down. If the bottleneck is going from an insight to a live campaign, aiRA by Capillary is our top pick, since it handles analysis and campaign execution in one workflow. If your team mainly needs dashboards and has analysts to build them, Tableau or Power BI are safer choices. For a smaller budget, Metabase is a solid place to start.
What is a self-service analytics tool?
It’s software that lets non-technical people query, visualize, and share data without waiting on a data engineer or analyst. You ask a question, you get an answer, and the data team stays focused on keeping the foundation clean instead of answering every request.
What is the difference between self-service analytics and traditional BI?
In traditional BI, analysts build the reports and everyone else requests them, which means a queue. In self-service analytics, the business user explores the data directly. The tradeoff is that self-service still needs good data modeling and governance behind it, or you end up with fast answers that nobody trusts.
Do you need SQL to use self-service analytics software?
Not for everyday questions. Most tools on this list let you ask in plain English or build charts with point-and-click controls. That said, some of them, like ThoughtSpot and Looker, need a data team to model the data first, so SQL skills may still be needed behind the scenes even if your marketers never touch them.
How much does a self-service analytics tool cost?
It ranges widely. Metabase’s open-source edition is free to self-host, Power BI Pro is $14 per user per month, and ThoughtSpot Essentials starts at $25. Enterprise-grade options like Looker, Sigma, and Databricks are quote-based, and aiRA by Capillary is custom-priced as well. Whatever you choose, ask what AI features, extra usage, and add-ons cost, since that’s where bills tend to grow.

Analytics and Insights
10 Best Self-Service Analytics Tools for Marketers and Business Teams in 2026Marketing teams run on data, but getting a straight answer out of that data is
Analytics and Insights
7 Best Augmented Analytics Tools for Marketing and CRM Teams in 2026Most dashboards show you what happened, but they leave the digging to your team. Augmented
Blogs
Power BI vs Tableau vs aiRAYour Dashboard Shows the Drop. aiRA Shows Why, & What to Do About It. Power