- Design industry shaping loyalty programs
- Integrate easily and go live quicker
- Deliver hyper-personalized consumer experiences

Capillary: Recognized as a Leader in Everest Group’s PEAK Matrix® 2025 Read more >
The Balanced Loyalty Quotient Report 2026 is now live — our largest and most in-depth loyalty report yet. Download Report >
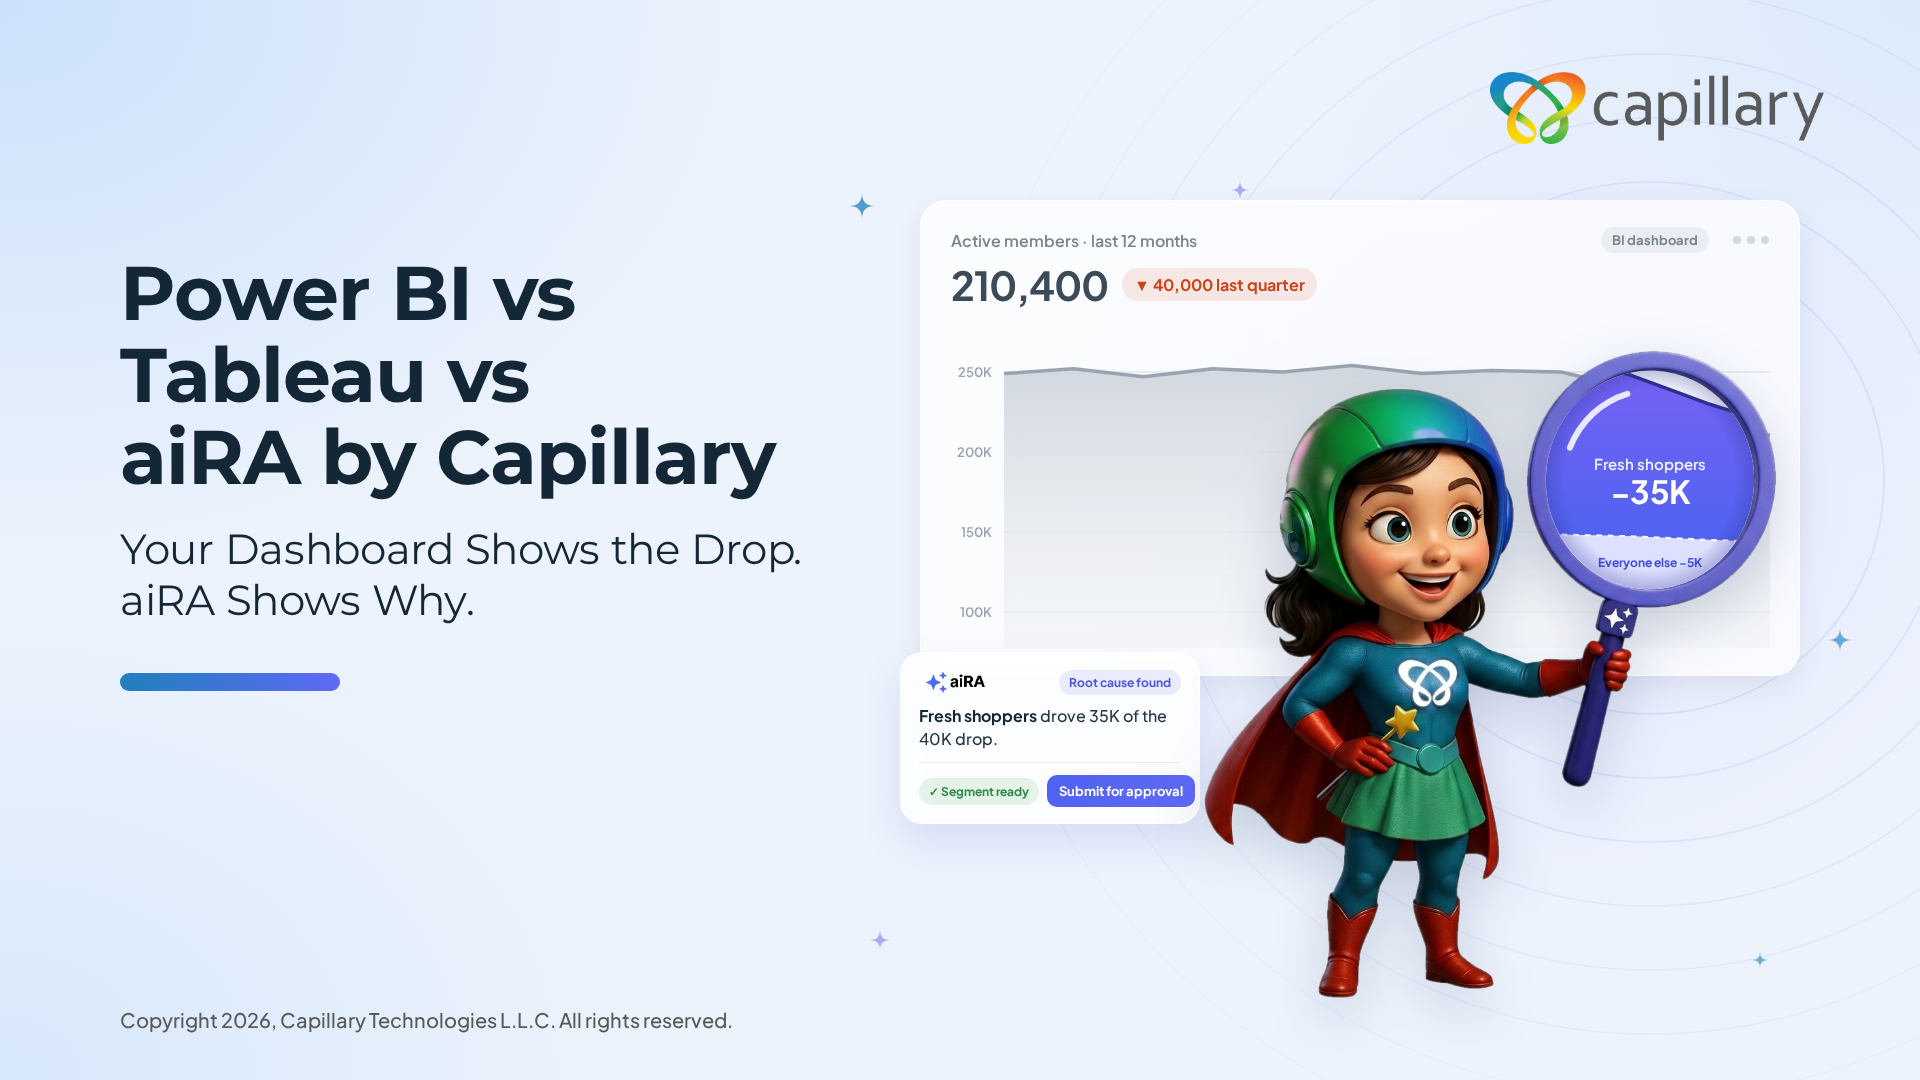
Power BI and Tableau are excellent at reporting on the business. aiRA by Capillary picks up where they stop: it finds out why customer behaviour changed, then builds the campaign to act on it. Here's how the three compare.
aiRA works where 100+ enterprise brands already trust Capillary













The report is clear: 40,000 members went quiet last quarter.
Any marketer knows what to ask next. Who are they? What did they stop buying? Which offer would bring them back?
In most teams, only a handful of analysts can put those questions to the data, and every marketer's request joins their queue. By the time the answers come back, many of those 40,000 members are already shopping somewhere else.
None of this is the dashboard's fault. Power BI, built into the Microsoft stack, is one of the most widely adopted BI platforms in the world, and Tableau remains the benchmark for visual analytics. For reporting across the business, either one is a sensible default.
So the real issue isn't which platform is more powerful. For a customer analytics buyer, it's narrower: who asks the question, and what happens once the answer arrives.
Power BI and Tableau are BI tools that report what changed in your data. aiRA by Capillary is an agentic customer analytics platform that lets marketing teams ask why customer behaviour changed, and turns the answer into action.
Charts the metrics you tell it to chart. Trend lines, KPIs and totals across a modelled dataset. Gives a clear view of the what, once an analyst has built the model.
Lets an analyst explore and visualise the same data with more design control. Professional, flexible views, but turning them into action is still largely on you.
Goes past the number to the reason: root cause, need-states, propensity, category affinity. Explains it in plain language, and builds the segment, reward and campaign to act on it.
What matters to customer and marketing teams, from who can ask a question to what it costs.
| Power BI | Tableau | aiRA by Capillary | |
|---|---|---|---|
| What an answer includes | A chart or summary from the prepared model | A visualisation or metric insight | The answers, the reason behind it, and the audience to act on it |
| Who can self-serve | Analysts, technical business users | Analysts and data-literate users | Marketers, CRM, and growth teams directly. No SQL, DAX or modelling |
| Insight-to-action | Generic actions from reports, like updating records or triggering workflows, built by your team | Actions from insights via Tableau Next and Salesforce workflows, set up by your team | Loyalty-native actions built in: segments, rewards, coupons and campaigns, ready to approve |
| Out of the box customer & industry context | Blank canvas; you need to model it | Blank canvas; you need to model it | Pre-built playbooks per industry, no modelling from scratch |
| Data movement required | Often imported / modelled first | Extracts or live connections, modelled | Reads data where it sits such as Databricks, Snowflake, BigQuery, Redshift. Sandboxed, read-only |
| Governance & PII for AI | Org-configured | Org-configured | PII masked before reaching LLM. Human approval on every action. Full audit trail. |
| Pricing model | Per-user (Pro, Premium Per User) or Fabric capacity | Per user Viewer, Explorer and Creator tiers, plus Tableau+ | Credits on work done, no per-seat license |
Choose Power BI or Tableau for company-wide reporting built and maintained by analysts.
Choose aiRA by Capillary when customer and marketing teams need to find out why customer behaviour changed and launch the response themselves.
A US healthcare provider ran its customer-facing engagement reporting on 16 Power BI dashboards, per-seat licences and an outside partner to maintain them. Only a handful of people could write DAX, so every change, even a label, took a full development cycle, with up to ten requests in the queue.
The team rebuilt all 16 dashboards as a single aiRA app, laid out like the originals so no one had to relearn anything. Every change since has happened in chat.
| Power BI | aiRA by Capillary | |
|---|---|---|
| Reporting stack | 16 dashboards | 1 app |
| Power BI licences | $100K a year, per seat | Cancelled |
| Skill needed | DAX | Chat |
| Turnaround on a change | Weeks | Minutes |
| Client decks | On request | 1 click |
| Ad-hoc questions | - | In app |
No retraining was needed on the client side, and nothing about the reporting their own customers receive changed.
See what this looks like for your team with a real working session ➡
Here's what happens when the customer question goes to aiRA instead of the data team's queue, with your approval before anything reaches a customer.
See what's happening, and why
aiRA reads your customer and loyalty data to explain the drop, not just report it.
Pick the right offer and audience
aiRA recommends the move most likely to work and shows the reasoning and projected impact before you commit.
Launch it on your approval
You review, refine and approve the strategies generated. Then it goes live, measured from day one.
A BI tool gives every business the same blank canvas. aiRA by Capillary comes with the questions, segments and campaigns that match how each industry actually runs.
| Industry | Outcomes |
|---|---|
| Hospitality | More stays, on-property spend, direct bookings. |
| Digital Experience | More engagement, fewer cancellations, richer rewards. |
| Supermarkets | Bigger baskets, more visits, cross-aisle shopping. |
| Fuel Retail | More fill-ups, more shop visits, fleet growth. |
| Fashion Retail | More visits, stronger launches, less discounting |
| Airlines | More miles activity, higher tiers, add-on revenue |
| Healthcare | Better adherence, preventive and wellness care |
| Pharmacy Retail | More refills, health cross sell, script linked rewards |
| Banks | More card spend, better rewards, less churn |
| Industry | Analyse | Decide | Act |
|---|---|---|---|
| Hospitality | Guest-value analysis, lapse-risk model, RCA | Stay-frequency reward, ancillary attach, direct-book incentive | Tier milestones, cross-property promo, win-back |
| Digital Experience | Churn propensity, usage segmentation, RCA | Engagement rewards, points marketplace, tier design | Retention journeys, reactivation campaigns |
| Supermarkets | Category affinity, churn propensity, RCA on baskets | Basket builder & cross-sell promos, private-label push | Personalised coupons, win-back journeys |
| Fuel Retail | Attach-rate, fleet profiling, pump & card fraud | Fill-frequency reward, fuel-grade upsell, fleet tiering | Location targeting, B2B fleet loyalty, win-back |
| Fashion Retail | Style & size affinity, churn propensity, RCA | Visit milestones, seasonal drops, full-price protection | VIP-access promos, post-purchase journeys, creatives |
| Airlines | Route & cabin analysis, status-risk model, fraud | Miles earn & burn, tier fast-track, ancillary attach | Bonus-miles win-back, status milestones, campaigns |
| Healthcare | Adherence drop-off, engagement propensity, consent audit | Wellness rewards, adherence nudges, outcome-linked rewards | Consent-safe journeys & reminders, member tiering |
| Pharmacy Retail | Refill-gap detection, health cross-shop, fraud | Refill-frequency reward, compliant script-linked earn | Front-of-store attach, refill win-back, reminders |
| Banks | Attrition model, spend-category analysis, fraud | Card-spend rewards, merchant-funded offers, tiering | Reward redemption, attrition journeys, campaigns |
For customer and engagement reporting, it can. A US healthcare provider retired 16 Power BI dashboards and $100K a year in licensing within a month, replacing them with a single aiRA app its team updates in chat. For company-wide finance and operations reporting, Power BI and Tableau remain the right tools.
No. Reads data where it sits (Databricks/Snowflake/BigQuery/Redshift), with sandboxed read-only access.
No. You ask questions in plain English, and aiRA handles the queries.
PII is masked before anything reaches the LLM. Every customer-facing action needs human approval, and there's a full audit trail. Capillary Technologies is ISO 27001 and PCI DSS certified, and supports GDPR, CCPA and PDPA.
No. aiRA recommends and builds segments, rewards and campaigns, but nothing reaches a customer until someone on your team approves it.
Most teams go from first conversation to full deployment in 2 to 4 weeks, including testing aiRA on your own data.
aiRA by Capillary is priced on credits for the work it does, rather than per-seat licences.
Thirty minutes, your data, one real question. We reply within one business day with a time and the security brief.
Book a working session


