
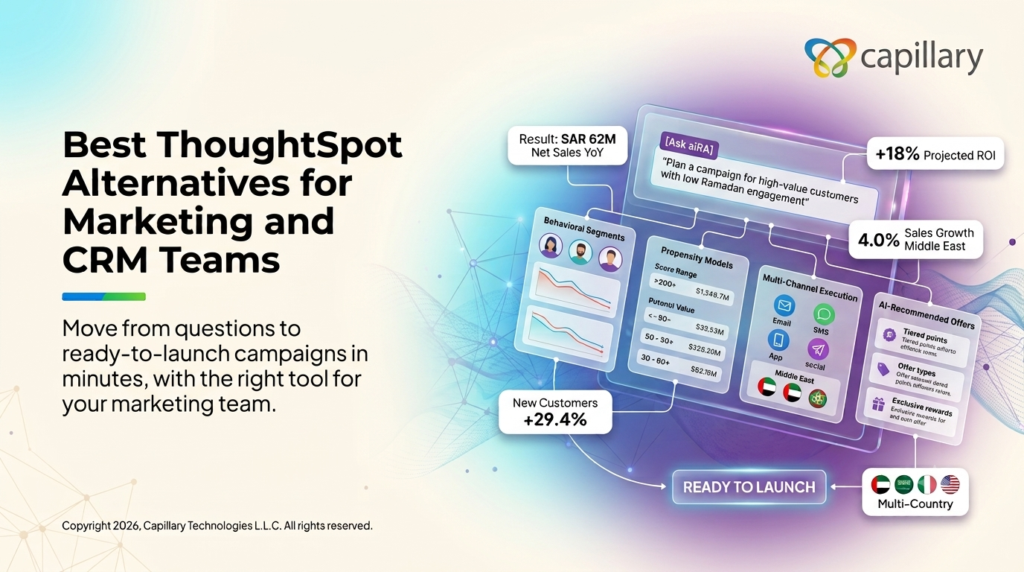
ThoughtSpot makes it easy for business users to ask questions about their data and get answers fast.
For marketing, CRM, and customer insights leaders, the work usually continues after the answer: building the right audience, choosing an offer, shaping the message, and setting up the campaign. And ThoughtSpot doesn’t do a very good job at doing this.
That’s why many teams are exploring alternatives, from analytics platforms to AI agents that help take customer insight all the way to a ready-to-launch campaign.
In this guide, we compare 10 ThoughtSpot alternatives. For each one, you’ll find who it’s best for, its key features, and pros and cons drawn from G2 and Capterra user reviews, so you can choose the right fit for your team.
TL;DR
Based on ease of use, fit for customer and campaign data, ability to act on insights, and time to value, these are the top 10 ThoughtSpot alternatives worth considering in 2026:
- aiRA by Capillary: Best overall ThoughtSpot alternative for marketing, CRM, and customer insights teams.
- Tableau: Best for custom visual dashboards built by analyst teams.
- Microsoft Power BI: Best for reporting within the Microsoft 365 ecosystem.
- Looker: Best for governed metrics on Google Cloud.
- Qlik Sense: Best for exploring complex data across many sources.
- Domo: Best for connectors, data prep, and dashboards in one cloud platform.
- Sigma Computing: Best for spreadsheet-style analysis on live cloud warehouse data.
- Hex: Best for SQL and Python analysis shared as data apps.
- Amazon QuickSight: Best for serverless BI on AWS.
- Sisense: Best for embedding analytics into your own products.
Why consider a ThoughtSpot alternative
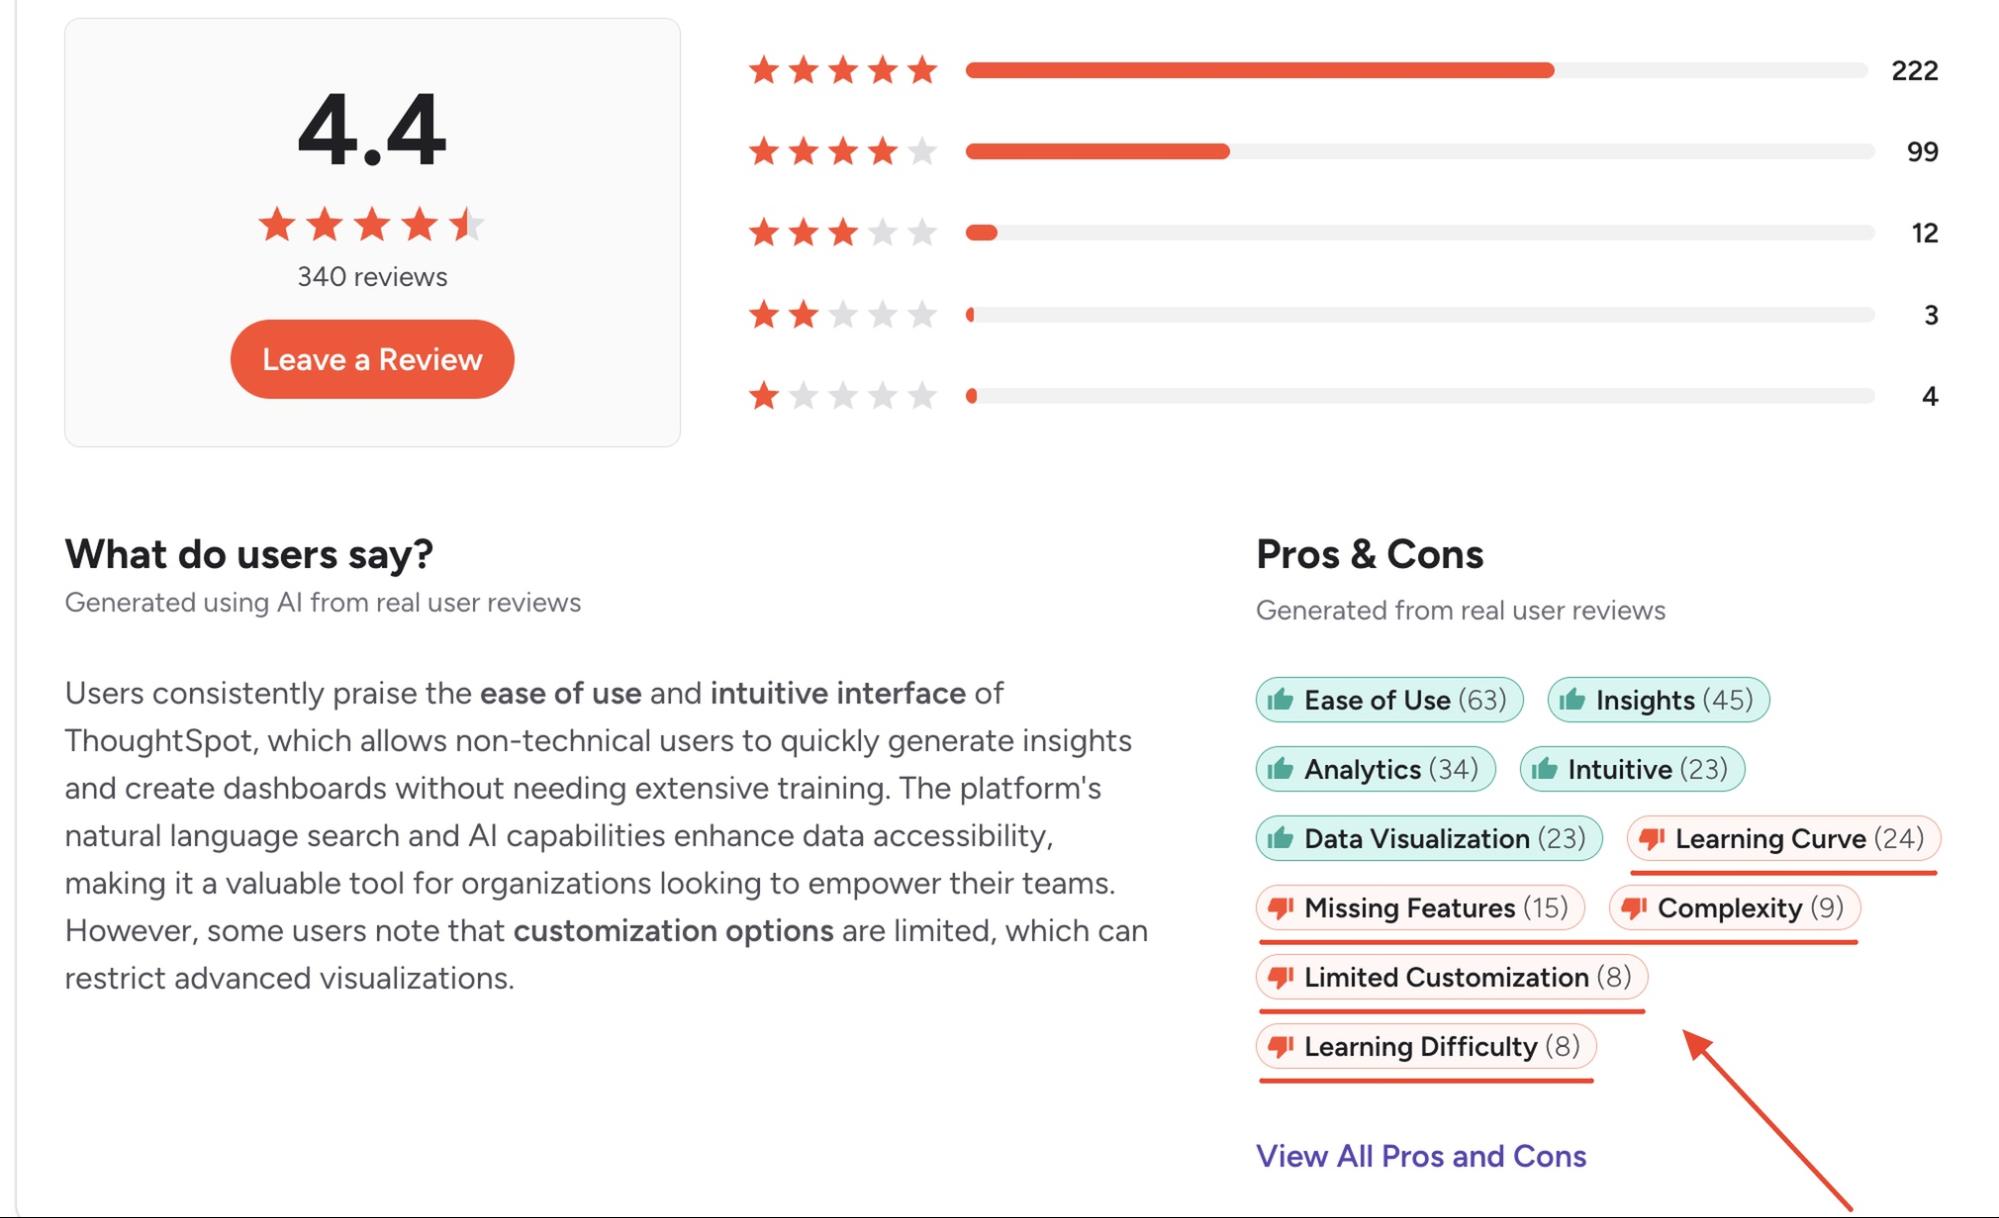
ThoughtSpot has a 4.4-star rating on G2 from 340 reviews. There’s no doubt to the fact that this score is earned. Reviewers consistently credit it for ease of use (63 mentions) and fast insights (45 mentions).
But an average rating only tells you part of the story. The more useful signal is the complaint that keeps coming back.
When you read through ThoughtSpot’s recent G2 reviews, a few themes repeat:
- Learning curve (24 mentions): “It takes a long time to really learn it.”
- Missing features (15 mentions): “I find the flexibility to transform data very limited.”
- Complexity (9 mentions): “The formulas don’t use SQL or Excel-style formatting, so they’re difficult to build.”
- Limited customization (8 mentions): “Liveboards/Answers aren’t as customizable as other BI tools.”
ThoughtSpot works best when a data team has already modeled your warehouse. It is harder going when you need answers before that groundwork is done.
One reviewer in financial services put it simply: “Much of the functionality is dependent on a good understanding of dimensional modeling.”
That’s the gap many teams hit once a rollout moves beyond the data team.
That’s why we’ve rounded up the best ThoughtSpot alternatives worth evaluating in 2026.
How this list was tested and selected
A good ThoughtSpot alternative should let someone outside the data team ask a question and trust the answer. It shouldn’t need a fully modeled warehouse before it’s useful. And when you do want to tweak a formula or a dashboard, it shouldn’t send you hunting for a workaround.
So we took recurring complaints from ThoughtSpot’s reviews and turned each one into a criterion. Here are a few questions we asked when creating this list:
ThoughtSpot alternatives at a glance
10 ThoughtSpot alternatives to choose from
Here’s a detailed dive into ten ThoughtSpot alternatives you can choose from:
1. aiRA by Capillary
Best for: Enterprise marketing, CRM, and customer insights teams that need quick answers about customers and campaigns without waiting on data teams.
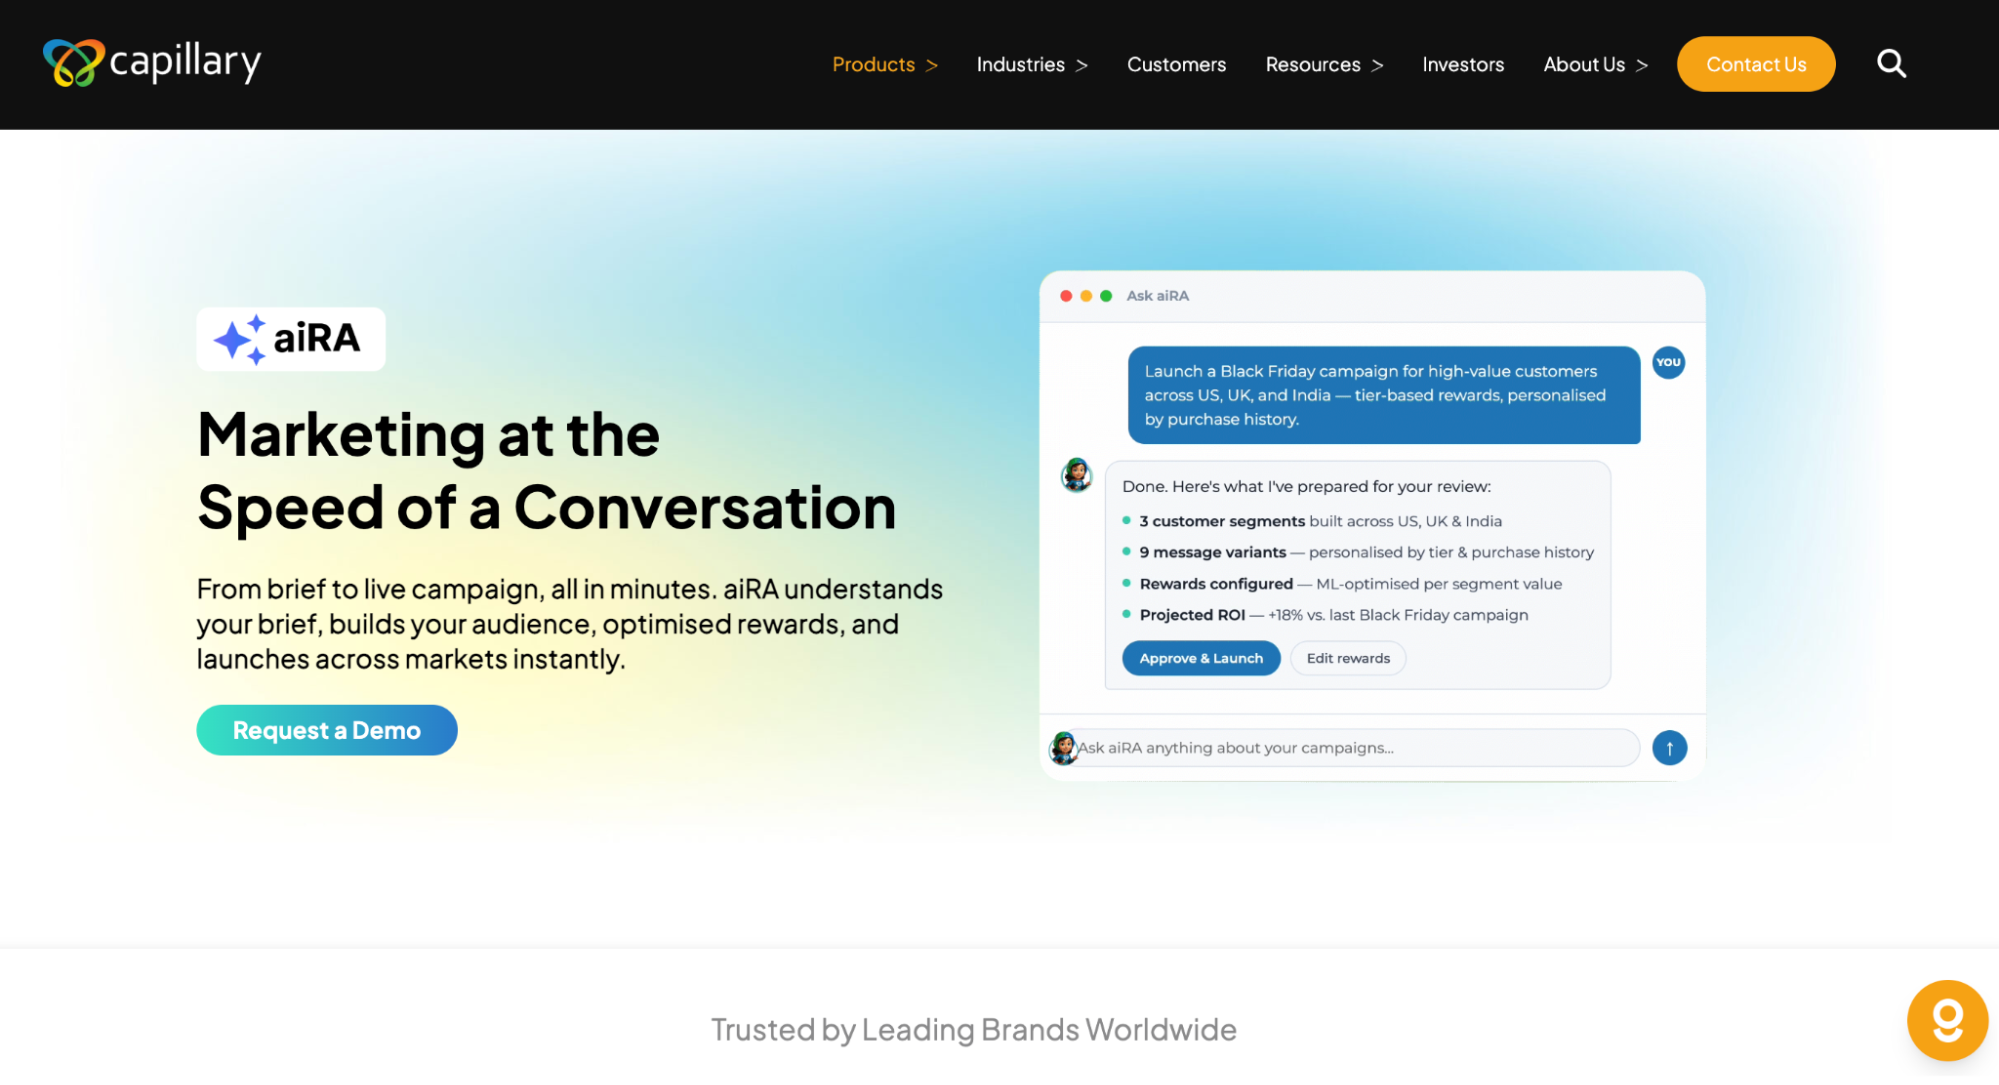
aiRA by Capillary is an AI agent for enterprise marketing and loyalty teams. With aiRA, you can ask questions about your customers in plain English.
aiRA answers using your brand’s own customer data. From there, it helps turn those insights into action: recommending offers, rewards, messaging, and channels.
aiRA by Capillary can also help turn these insights into actions. For example, you can set up the campaign with the team approving every step. Or you can create Jira tickets, notify in Slack, or trigger workflows in other apps.
Watch this YouTube video to see how you can create a marketing campaign in aiRA
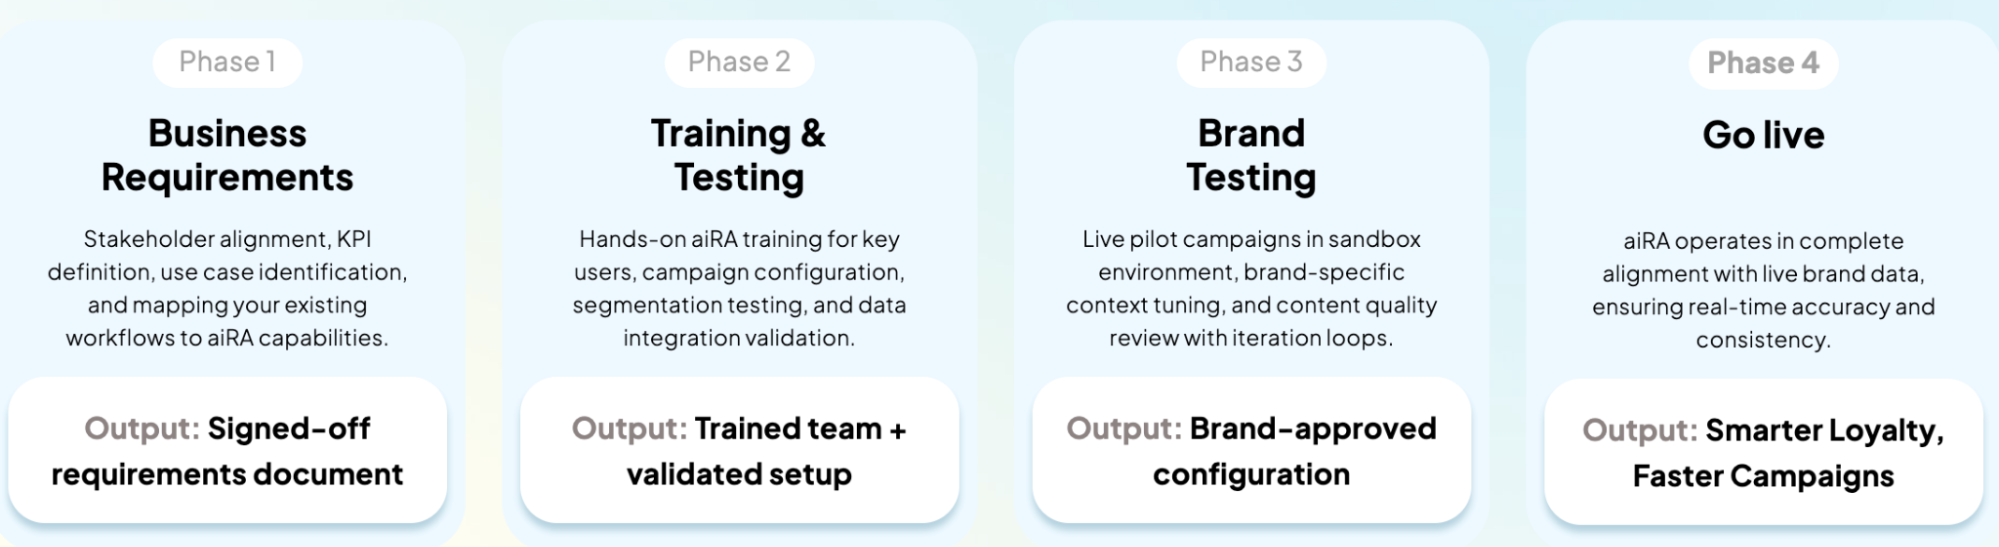
A full deployment of aiRA on your brand data can be done within 2-4 weeks from the first conversation. Throughout the deployment, you also get a dedicated Capillary success manager from Capillary Technologies.
Here’s a peek at what our process looks like:
Key features
- Natural language customer analytics: Ask questions in plain English to profile customers and spot behavioral trends like seasonal patterns and engagement signals. There’s no SQL to write and no analyst queue.
- Self-serve segmentation: Describe an audience and aiRA builds the segment, with propensity scores and projected campaign value for each one.
- Conversational campaign creation: Set up audience, rewards, messaging, and multi-channel delivery from a single brief.
- Campaign and reward recommendations: Get AI-recommended offer types, rewards, messaging, and channel mix. aiRA also predicts ROI by market and explains each recommendation.
- Multi-country, multi-language execution: Localize messaging per region and segment in one workflow.
- Enterprise governance: Personal data is masked before it reaches the LLM. All AI interactions are logged, with drift monitoring and incident SLAs. aiRA by Capillary is ISO 27001 aligned and compliant with PCI DSS and GDPR/CCPA/PDPA.
Pros
- Gives marketing and CRM teams direct access to customer insights and segments without routing requests through analysts
- Connects customer analysis, segmentation, campaign strategy, and measurement in one conversational workflow
- HITL (Human in the loop) on every customer-facing action and a full audit trail suit enterprise governance needs
Cons
- Built for enterprise marketing, CRM, and loyalty use cases, so teams at a startup stage may not find aiRA best suited.
Case study: Value-fashion retailer with a 14.7M-member loyalty program
During Ramadan 2026, a Middle East value-fashion retailer’s mass campaigns reached only 29% of its loyalty members, and two regions trailed the rest by 9.6 points in growth. aiRA built behavioral segments and a purchase-propensity model across five lifecycle groups, then ran the five-week campaign end to end, recalibrating each cycle.
- Regional growth gap cut from -9.6pp to -2.2pp
- New customers up 29.4% YoY
- Revenue per delivered contact up 11.6%
- Net sales of ~$62M (SAR 233M), up 4.0% YoY
- Beat a dedicated analytics agency on 8 of 9 KPIs
Want similar results?
See aiRA turn a question into a live campaign. Request a demo to see how aiRA works on your own brand data.
2. Tableau
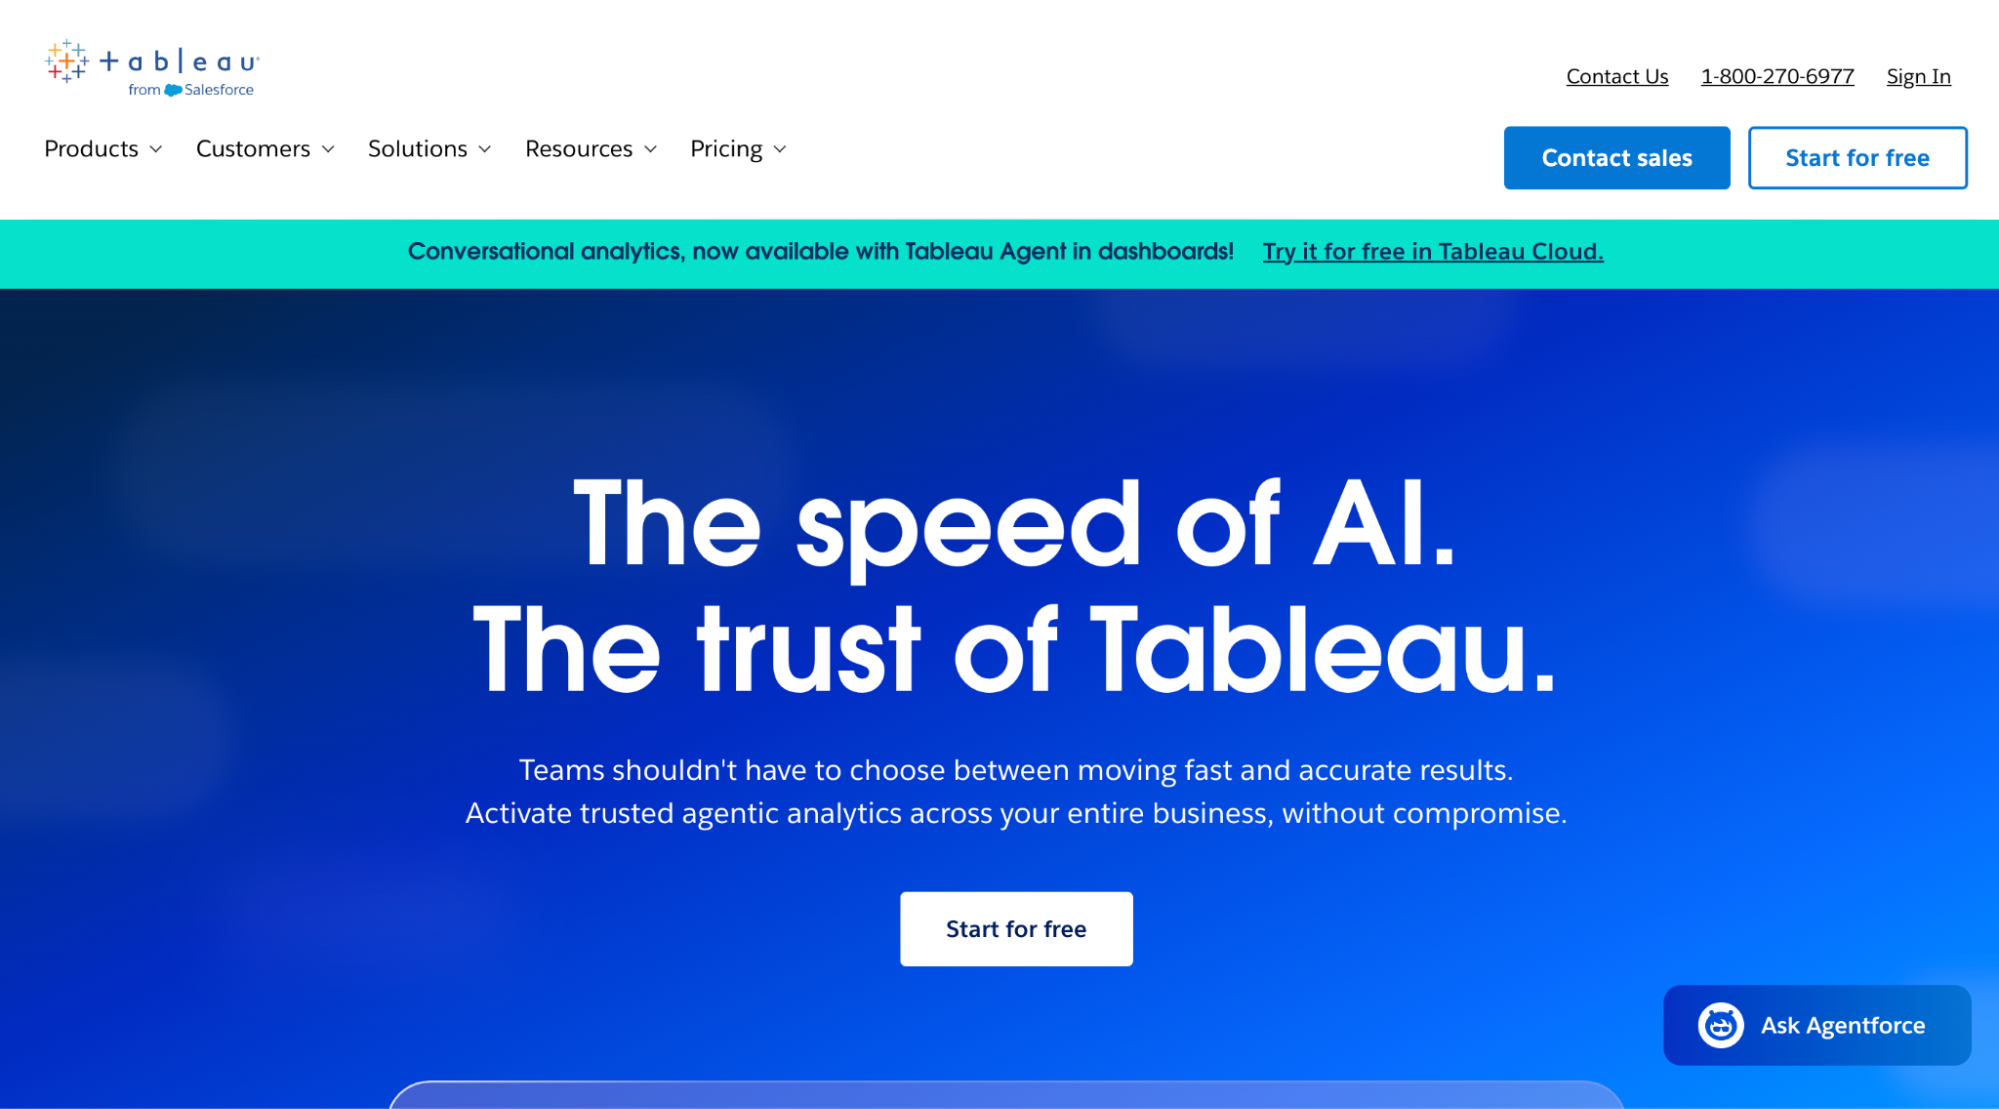
Best for: Analyst teams that build custom visual dashboards from lots of data sources.
Tableau is a BI platform from Salesforce, built around drag-and-drop visualization. It works best when a team of analysts designs and maintains dashboards for other people to use. It’s less suited to business users who want quick answers in plain English. Complex calculations and data prep often need specialist skills, so business teams usually rely on analysts to build new views when their questions change.
Key features
- Drag-and-drop visual analysis: Drag fields onto a canvas to build charts, maps and interactive dashboards with filters, drill-downs and calculated fields.
- Broad data connectivity: Connect to SQL databases and cloud warehouses.
- Tableau Pulse: Follow key metrics and get digests and alerts when they change.
Pros
- The drag-and-drop interface makes it easy to explore data (Murtuza L., G2)
- Connects to a wide range of apps and data sources (Komal S., G2)
Cons
- Working with data in natural language and automating data prep both need work (Krishna K., G2)
3. Microsoft Power BI
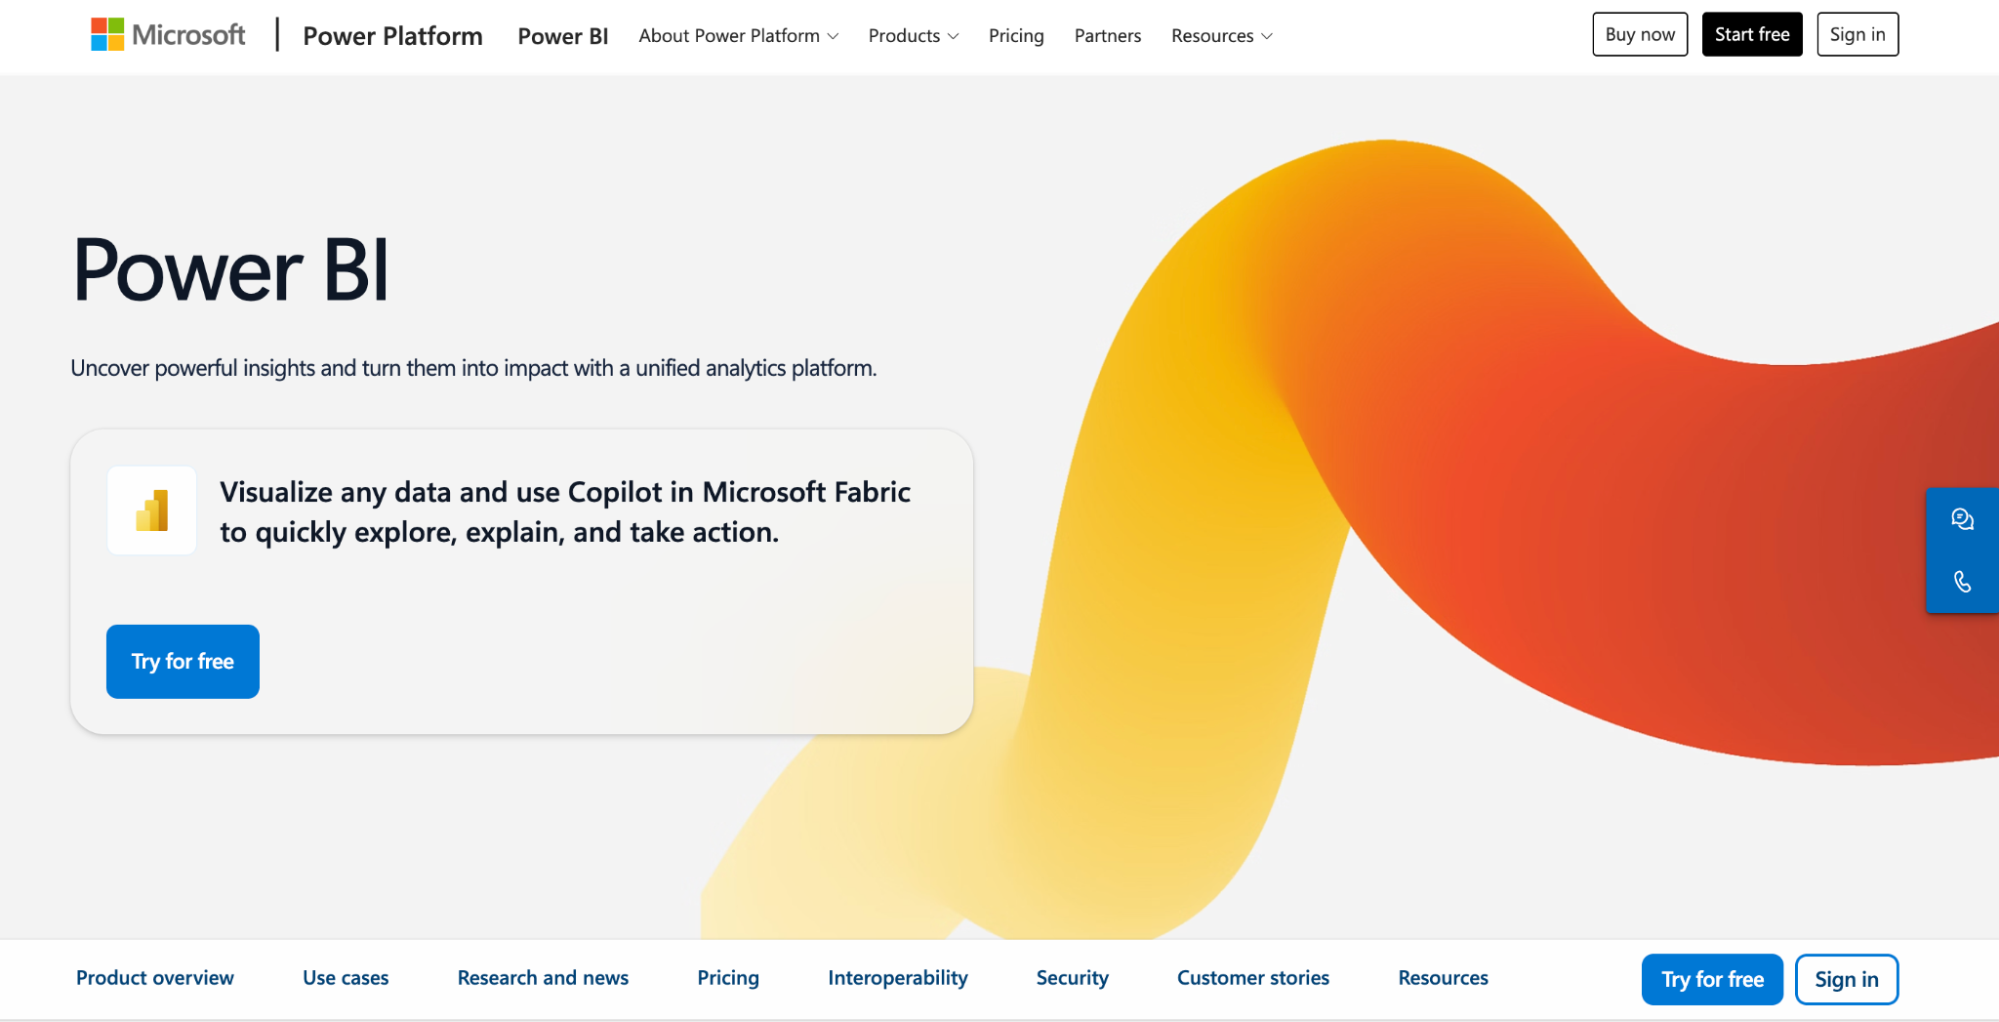
Best for: Organizations already on Microsoft 365 that want to keep their reporting inside the Microsoft ecosystem.
Power BI is Microsoft’s business intelligence platform. It turns data from Excel, SQL databases, and cloud sources into interactive reports and dashboards. It fits best with companies that already use Excel, SharePoint, and Teams and have BI developers to build and maintain the data models. Anything beyond basic reports usually needs DAX formulas and data modeling skills, so business users still depend on technical teams for new analysis.
Key features
- Power Query data prep: Clean, reshape, and merge data from Excel, SharePoint lists, SQL Server, and cloud sources.
- DAX and semantic modeling: Define relationships, measures, and calculations in reusable data models.
- Microsoft ecosystem integration: Analyze Power BI data in Excel, embed reports in Teams and SharePoint.
- Publishing and access control: Publish dashboards to the Power BI Service, schedule data refreshes, and set row-level security.
Pros
- Works with Excel, which makes it easy to use datasets you already have (Madhav K., G2)
- Power Query transforms data with little coding and connects to many sources (Swati J., G2)
Cons
- DAX formulas and data modeling are hard for beginners to learn, and the error messages aren’t clear (Mansi S., G2)
4. Looker
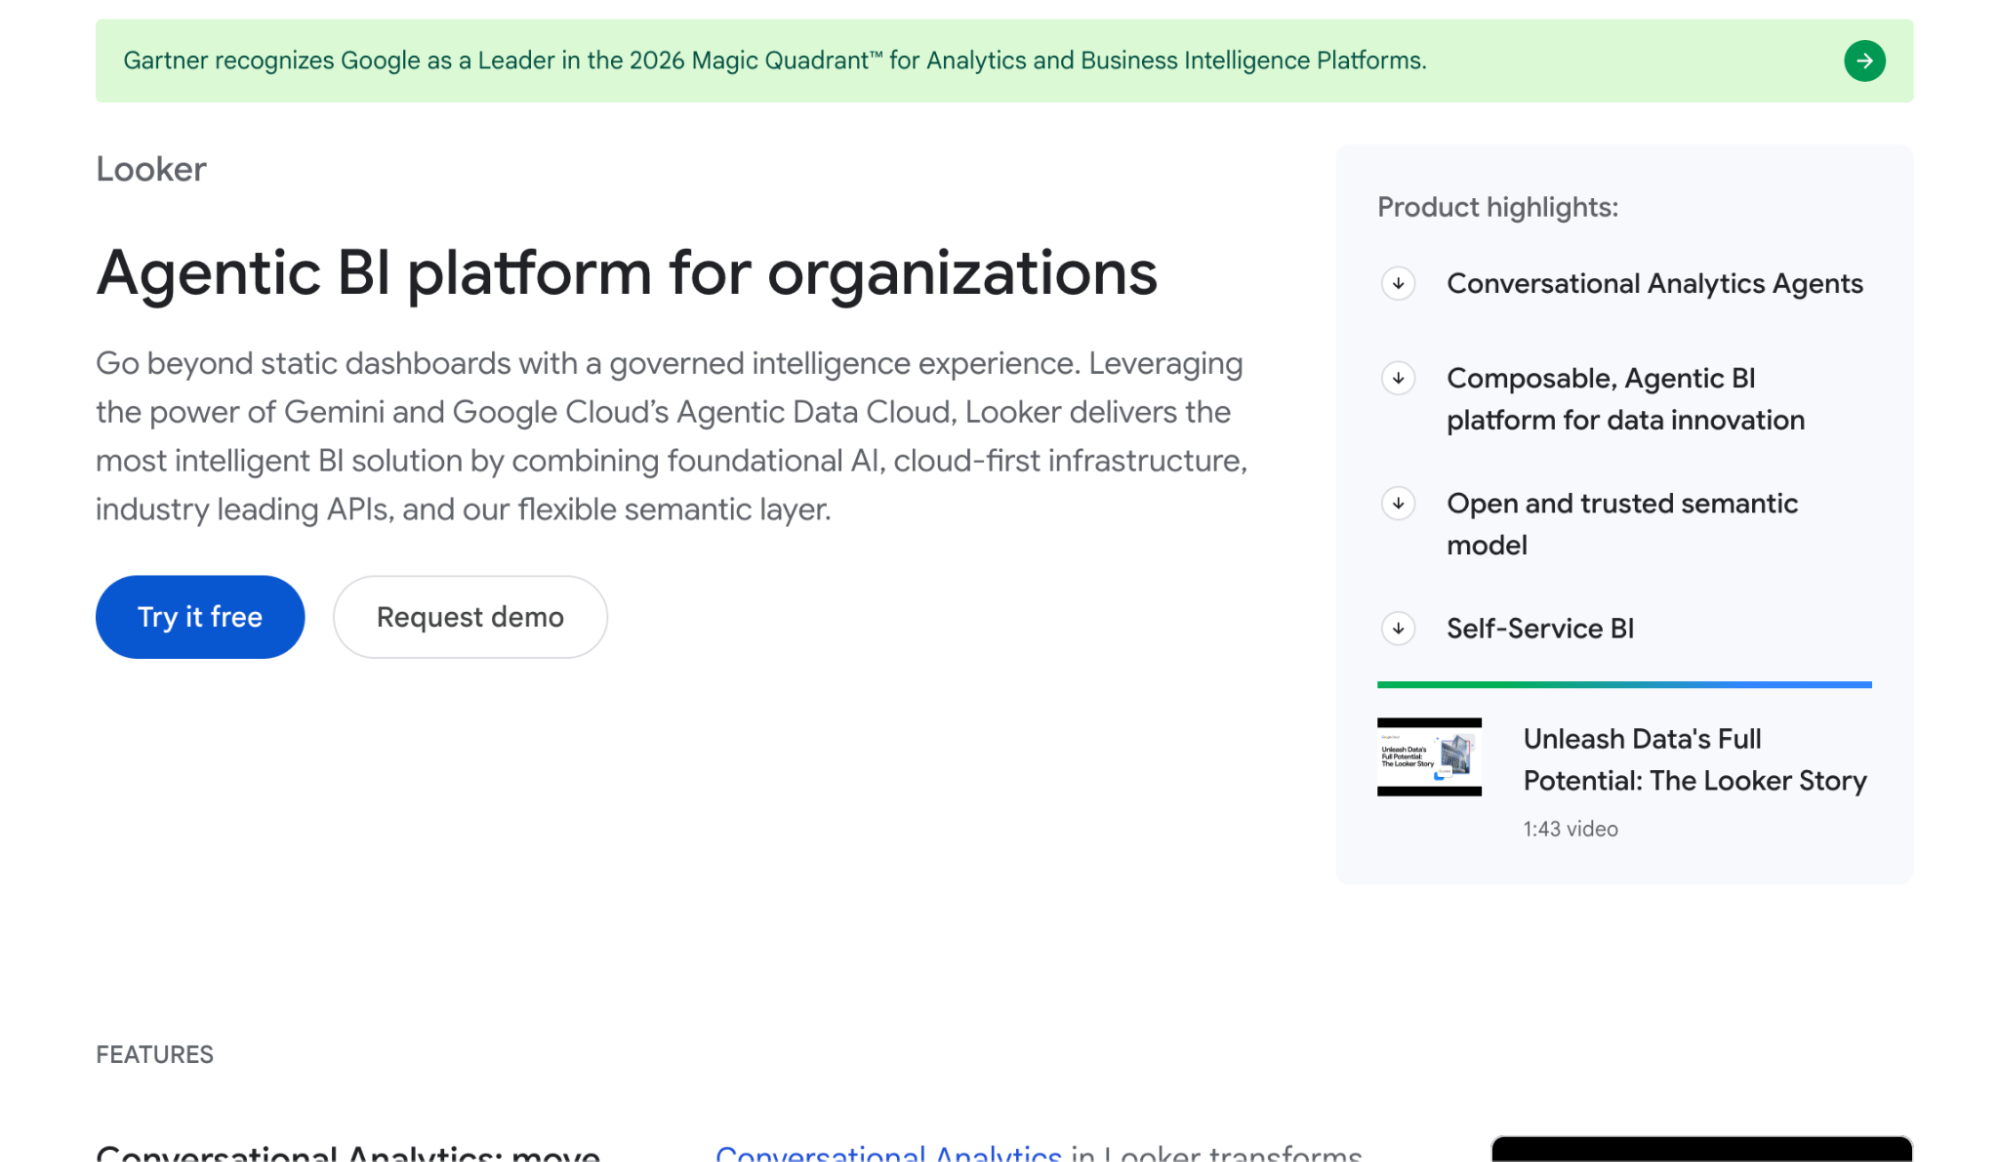
Best for: Data teams on Google Cloud that want governed metrics defined in code.
Looker is Google Cloud’s enterprise BI platform. It’s built around LookML, a modeling language that data teams use to define metrics, joins, and business logic once and reuse them in every report. It suits companies with dedicated data engineers and a modern cloud data warehouse. Business users can only explore data after engineers have modeled it in LookML, so quick, one-off questions often end up waiting in the data team’s queue.
Key features
- LookML semantic layer: Define KPIs, joins, and business logic in code with Git version control.
- In-database architecture: Query cloud warehouses like BigQuery, Snowflake, and Redshift directly without copying data.
- Scheduled reports and alerts: Send dashboards and reports on a schedule to email, Slack, or cloud storage.
- Embedded analytics and APIs: Put Looker dashboards inside internal tools or customer-facing apps.
Pros
- Brings data from different sources into one place for dashboards and tracking metrics (Kaushik G., G2)
- Scheduled reports send the right numbers to inboxes every week without anyone running them by hand (Anurag S., G2)
Cons
- LookML is hard to learn, so business users depend on data engineers and have little room for quick ad hoc analysis (Susmita T., G2)
5. Qlik Sense
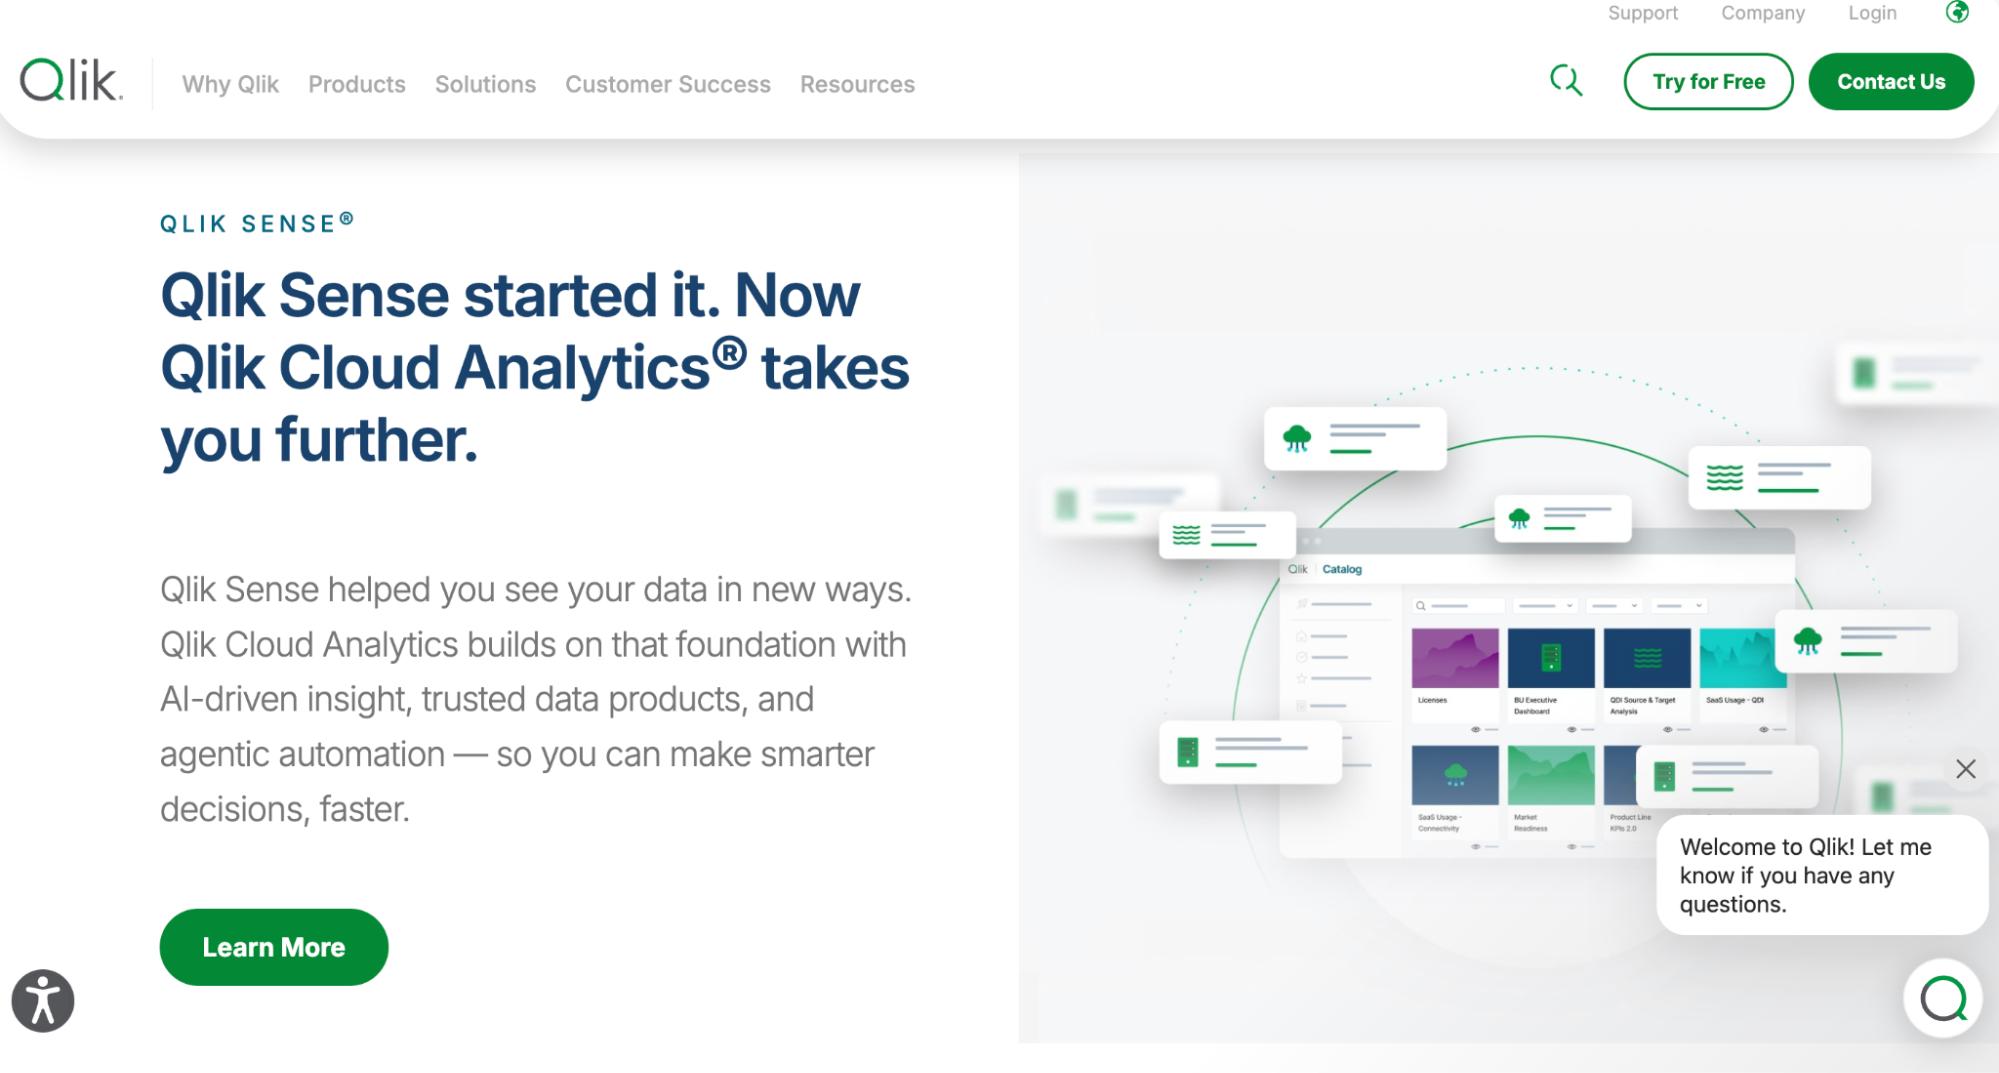
Best for: BI teams that want to freely explore complex data from many sources.
Qlik Sense is Qlik’s analytics platform, built on an associative engine that lets users click through data in any direction. It fits organizations with BI developers who can write Qlik’s load scripts and build data models before business users start exploring. Advanced setups and custom dashboards often take significant development work, so marketing and business teams usually need technical help for anything beyond ready-made views.
Key features
- Associative engine: Click any value to filter all charts at once, showing related and unrelated data.
- Data load scripting and modeling: Combine and transform data from databases, SAP, cloud apps, and files with Qlik’s script editor.
- Interactive dashboards and visualizations: Build drag-and-drop sheets with charts, maps, and KPIs that users can filter.
- Cloud or on-premises deployment: Run on Qlik Cloud or self-managed Windows servers.
Pros
- Handles both ETL and dashboarding in one place, so it’s easier to prepare data and then present it (Gaurav S., G2)
- Pulls together data from many kinds of sources quickly and works with other software to automate repetitive tasks (Verified User in Wholesale, G2)
Cons
- It takes a lot of time to learn the script functions and data load types, which beginners find hard (Anubhav K., G2)
6. Domo
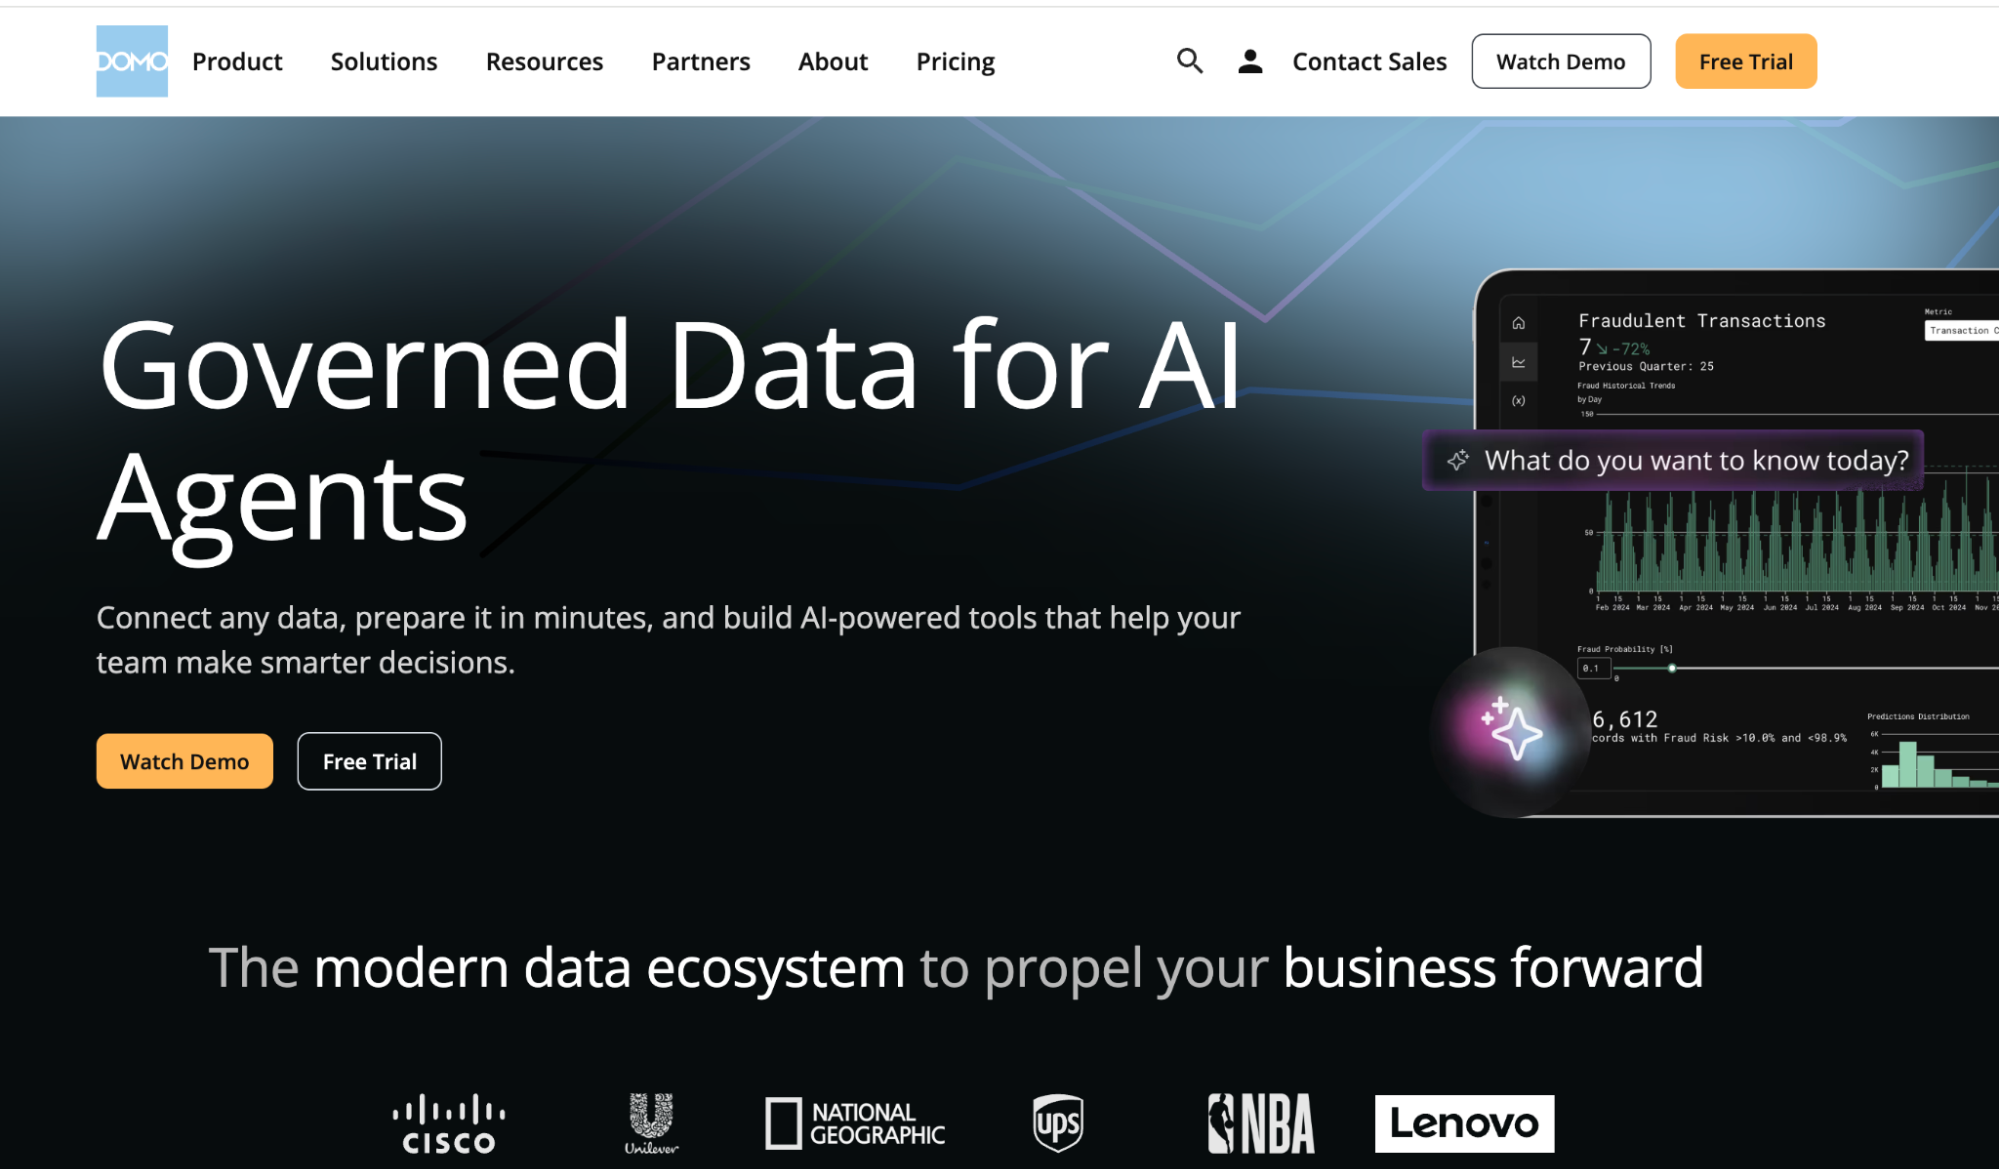
Best for: Mid-size and large companies that want connectors, data prep and dashboards in one cloud platform.
Domo is a cloud BI platform that combines data integration, transformation, and visualization in one place. It fits companies that want to pull data from many business systems into a hosted warehouse, with a BI team building the pipelines and dashboards. Day to day, the BI team usually runs Domo, and pricing based on users and data volume can get expensive and hard to predict as more people join.
Key features
- Prebuilt data connectors: Pull data from ERPs, CRMs, ad platforms, databases, and spreadsheets into Domo’s cloud warehouse.
- Magic ETL: Clean, join, and transform datasets with a drag-and-drop pipeline builder.
- Cards and dashboards with Beast Mode: Build visual cards and dashboards, and use Beast Mode calculations to create custom fields.
- Personalized data permissions (PDP): Control which rows of data each user or group can see.
Pros
- Builds metric dashboards and integrates with ERP and SaaS products (Aniruddha T., Capterra)
- Fast, powerful data transformations with a very broad range of data connections (Lexton D., Capterra)
Cons
- The interface isn’t intuitive, and moving between boards and projects can feel jumbled (Eleanor B., Capterra)
7. Sigma Computing
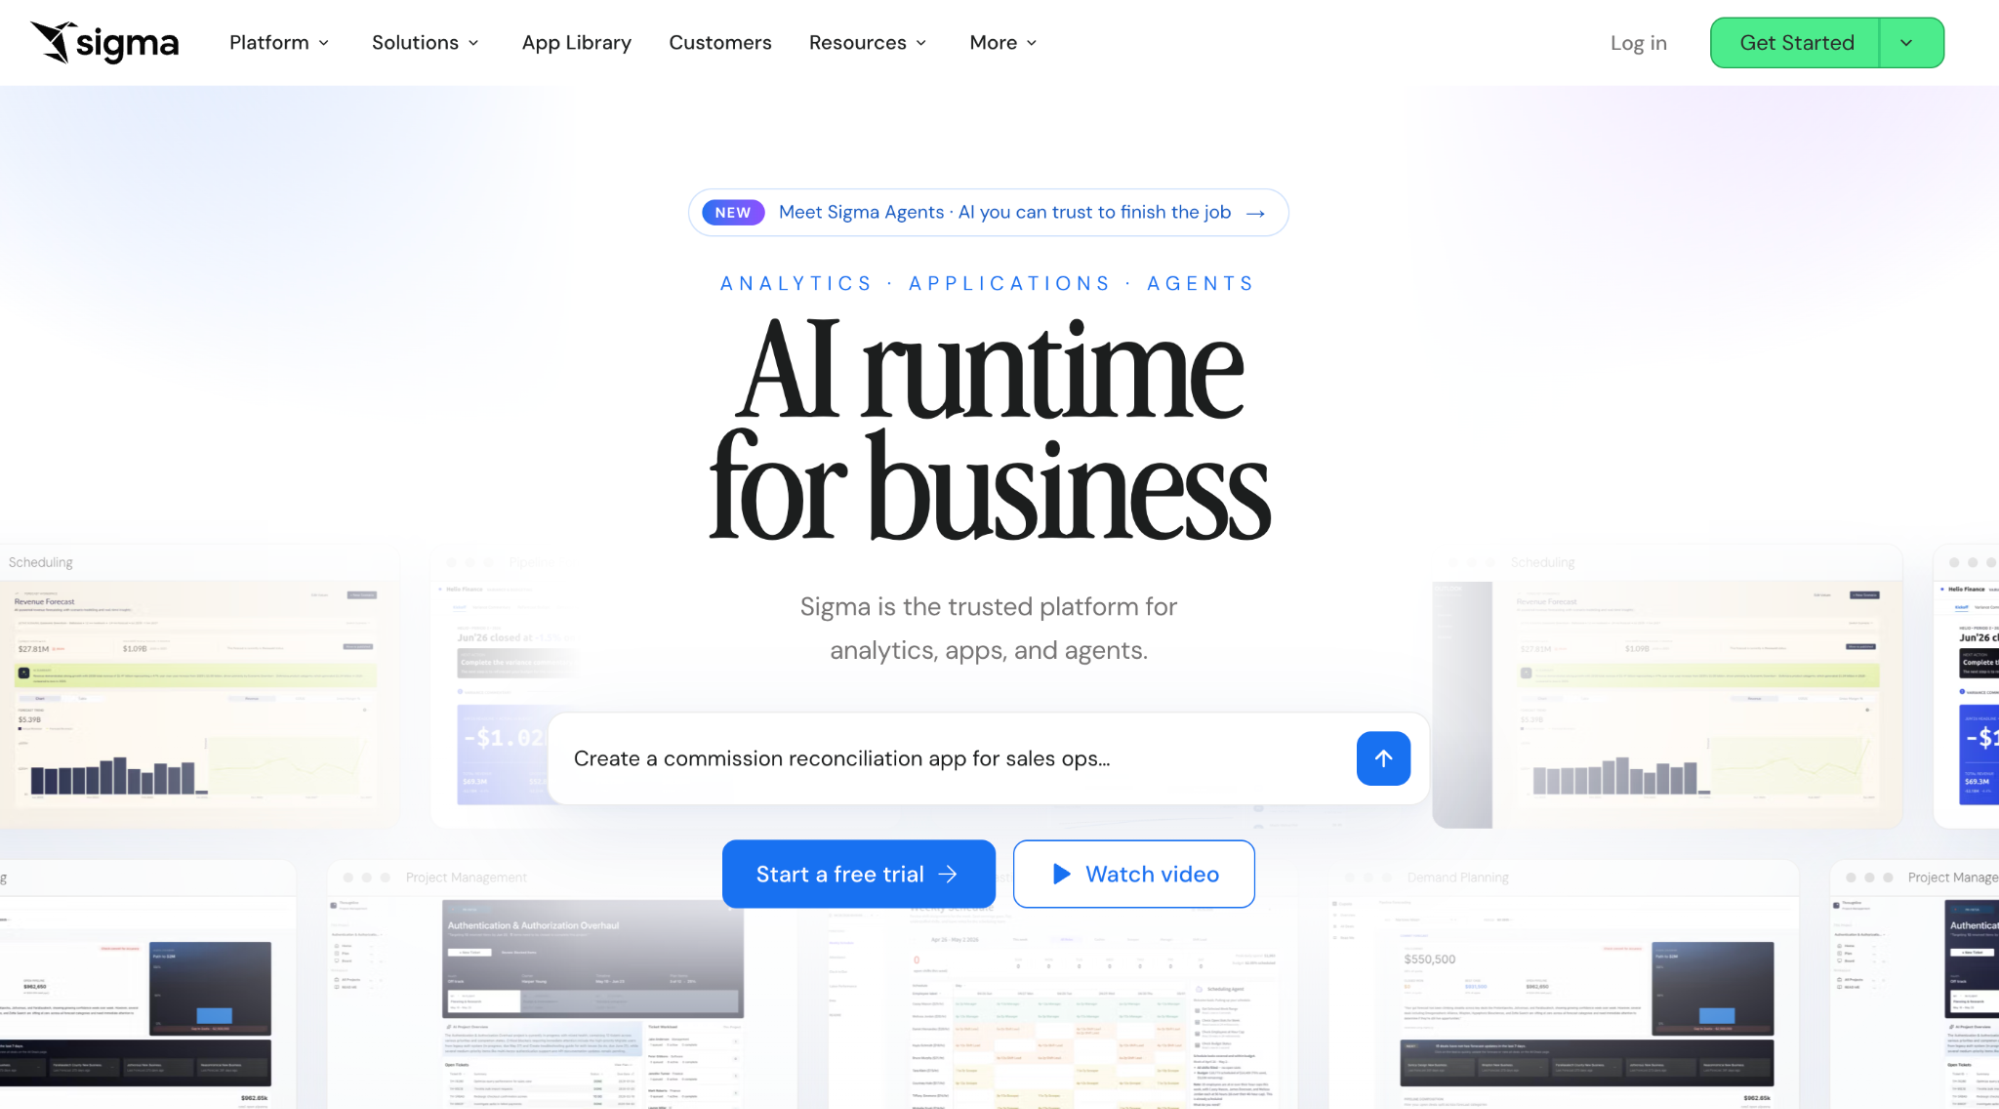
Best for: Data teams on Snowflake or other cloud warehouses that want spreadsheet-style analysis on live data.
Sigma is a cloud BI and analytics platform with a spreadsheet-like interface that queries the cloud data warehouse directly. It suits companies that have already centralized data in Snowflake, BigQuery, or Databricks and want analysts and Excel-savvy users to explore it without extracts. Someone still has to set up the warehouse, datasets, and permissions first, and new users need time to learn the workbook model before they’re productive.
Key features
- Spreadsheet-like workbooks: View, sort, filter, and write formulas on warehouse data in a familiar grid.
- Live warehouse queries: Connect directly to Snowflake, BigQuery, Databricks, and Redshift.
- Input tables: Add or edit data straight into the warehouse from a workbook for planning.
- Dashboards and embedding: Turn workbooks into interactive dashboards with filters and controls.
Pros
- Building dashboards is easy, and the UI elements are more polished than in other tools (Mariel B., G2)
- Easy to embed with iframes or the SDK, and edits made in the UI save back to the data store (Ibrahim A., G2)
Cons
- Gets laggy when workbooks have many elements or large datasets, and advanced features aren’t intuitive at first (Keerthan P., G2)
8. Hex
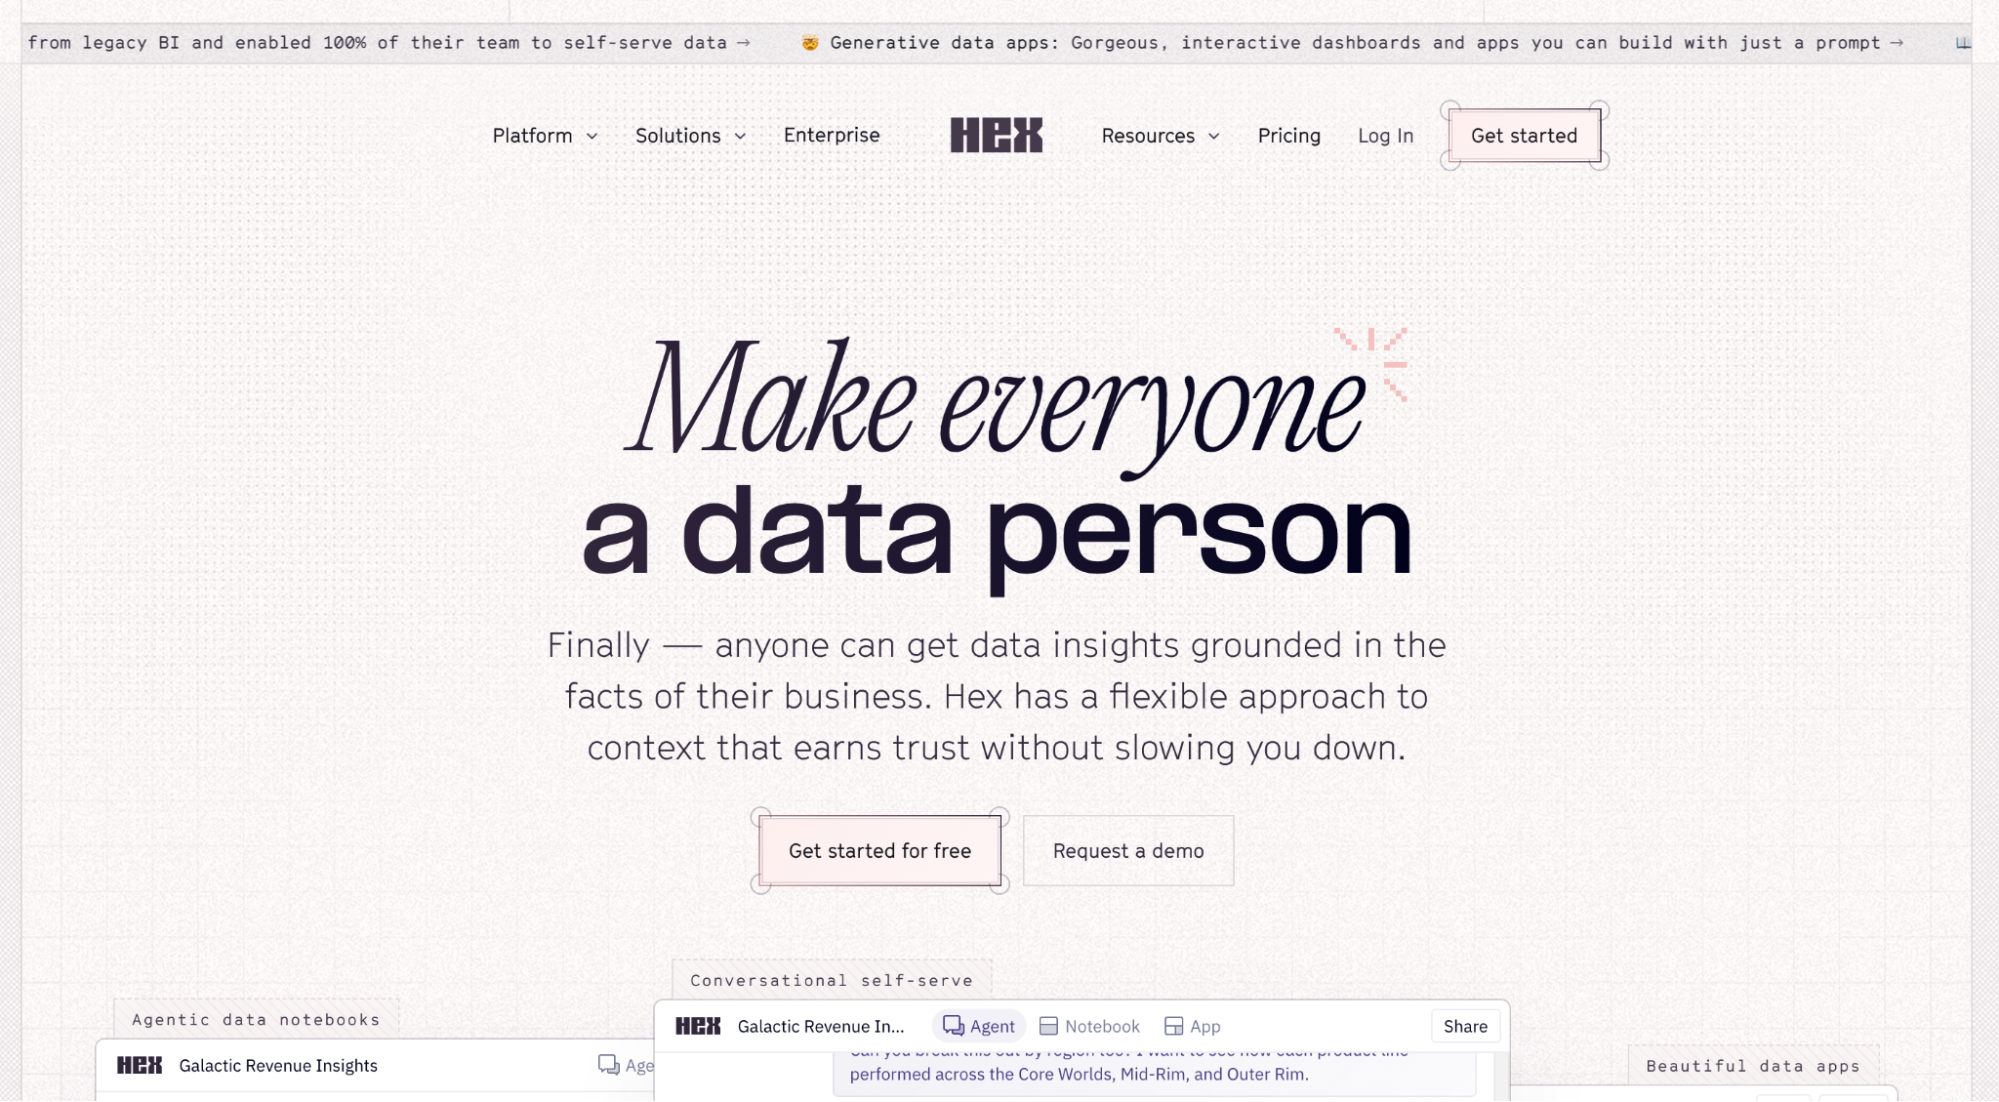
Best for: Data teams that work in SQL and Python and want one shared workspace for analysis and data apps.
Hex is a collaborative data workspace that combines SQL and Python notebooks with the ability to publish results as interactive data apps. It’s aimed at data analysts, analytics engineers, and data scientists who write code against a cloud data warehouse, then share the finished work with business teams. Stakeholders mostly use apps the data team has built, so new questions or changes still go back to the analysts. Reviewers also note that apps can load slowly on heavy warehouse queries.
Key features
- SQL and Python notebooks: Mix SQL and Python cells in one project, pass results between cells, and use the schema browser and autocomplete to find tables and write queries faster.
- Data apps: Turn notebook analyses into interactive apps and dashboards with inputs and filters.
- Scheduled runs and Git sync: Refresh published apps automatically on a schedule and trigger notifications, and sync projects with GitHub or GitLab for version control.
Pros
- Mixes SQL and Python in one notebook and keeps variables and tables so you can build on them (Queenie G., G2)
- Explore data, build interactive analyses, and share polished outputs in one collaborative place (Verified User in Retail, G2)
Cons
- Slow load times and limited sharing permissions make dashboards hard to share with a wide audience (Cormac M., G2)
9. Amazon QuickSight
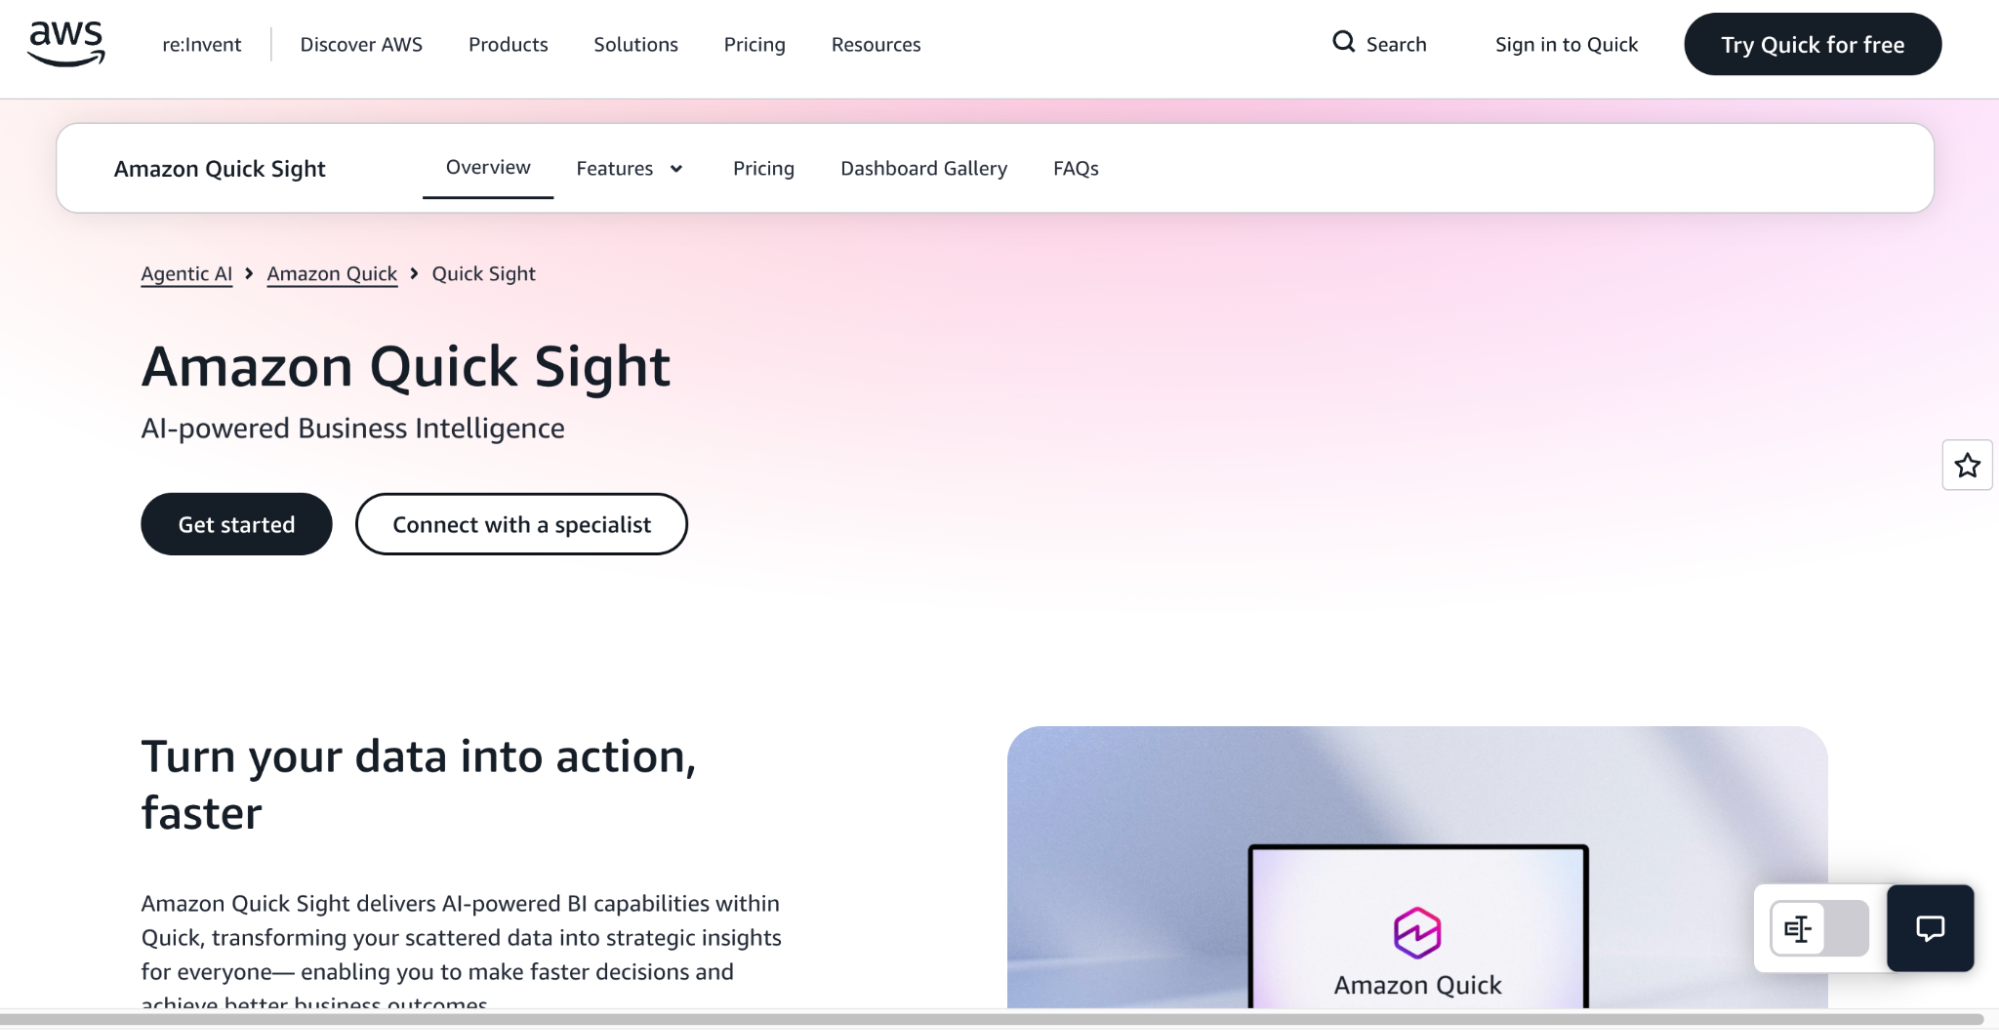
Best for: Companies already on AWS that want serverless BI dashboards close to their AWS data.
Amazon QuickSight, now renamed Amazon QuickSight and part of AWS’s Amazon QuickSight Suite, is AWS’s cloud BI service for building interactive dashboards without managing servers. It fits best with teams whose data already lives in AWS services like Redshift, Athena, and S3. Reviewers say it’s less flexible outside the AWS ecosystem, and complex dashboards and advanced visual customization can be hard to manage, so polished reporting usually takes BI engineering effort.
Key features
- Native AWS integration: Connect to AWS data services as well as external databases, data warehouses, and files, and prepare data with filters, calculated fields, and custom SQL.
- Embedded analytics: Embed interactive dashboards directly into internal or customer-facing applications.
- Enterprise security: Manage access with role-based access controls, single sign-on, and auditing.
Pros
- Builds interactive dashboards without managing BI infrastructure, and SPICE keeps them fast on large datasets (Atharva P., G2)
- Native integration with AWS services makes the analytics workflow smoother (Jawher S., G2)
Cons
- Works well mainly inside the AWS ecosystem, offers limited customization, and makes advanced use cases hard (Aviral G., G2)
10. Sisense
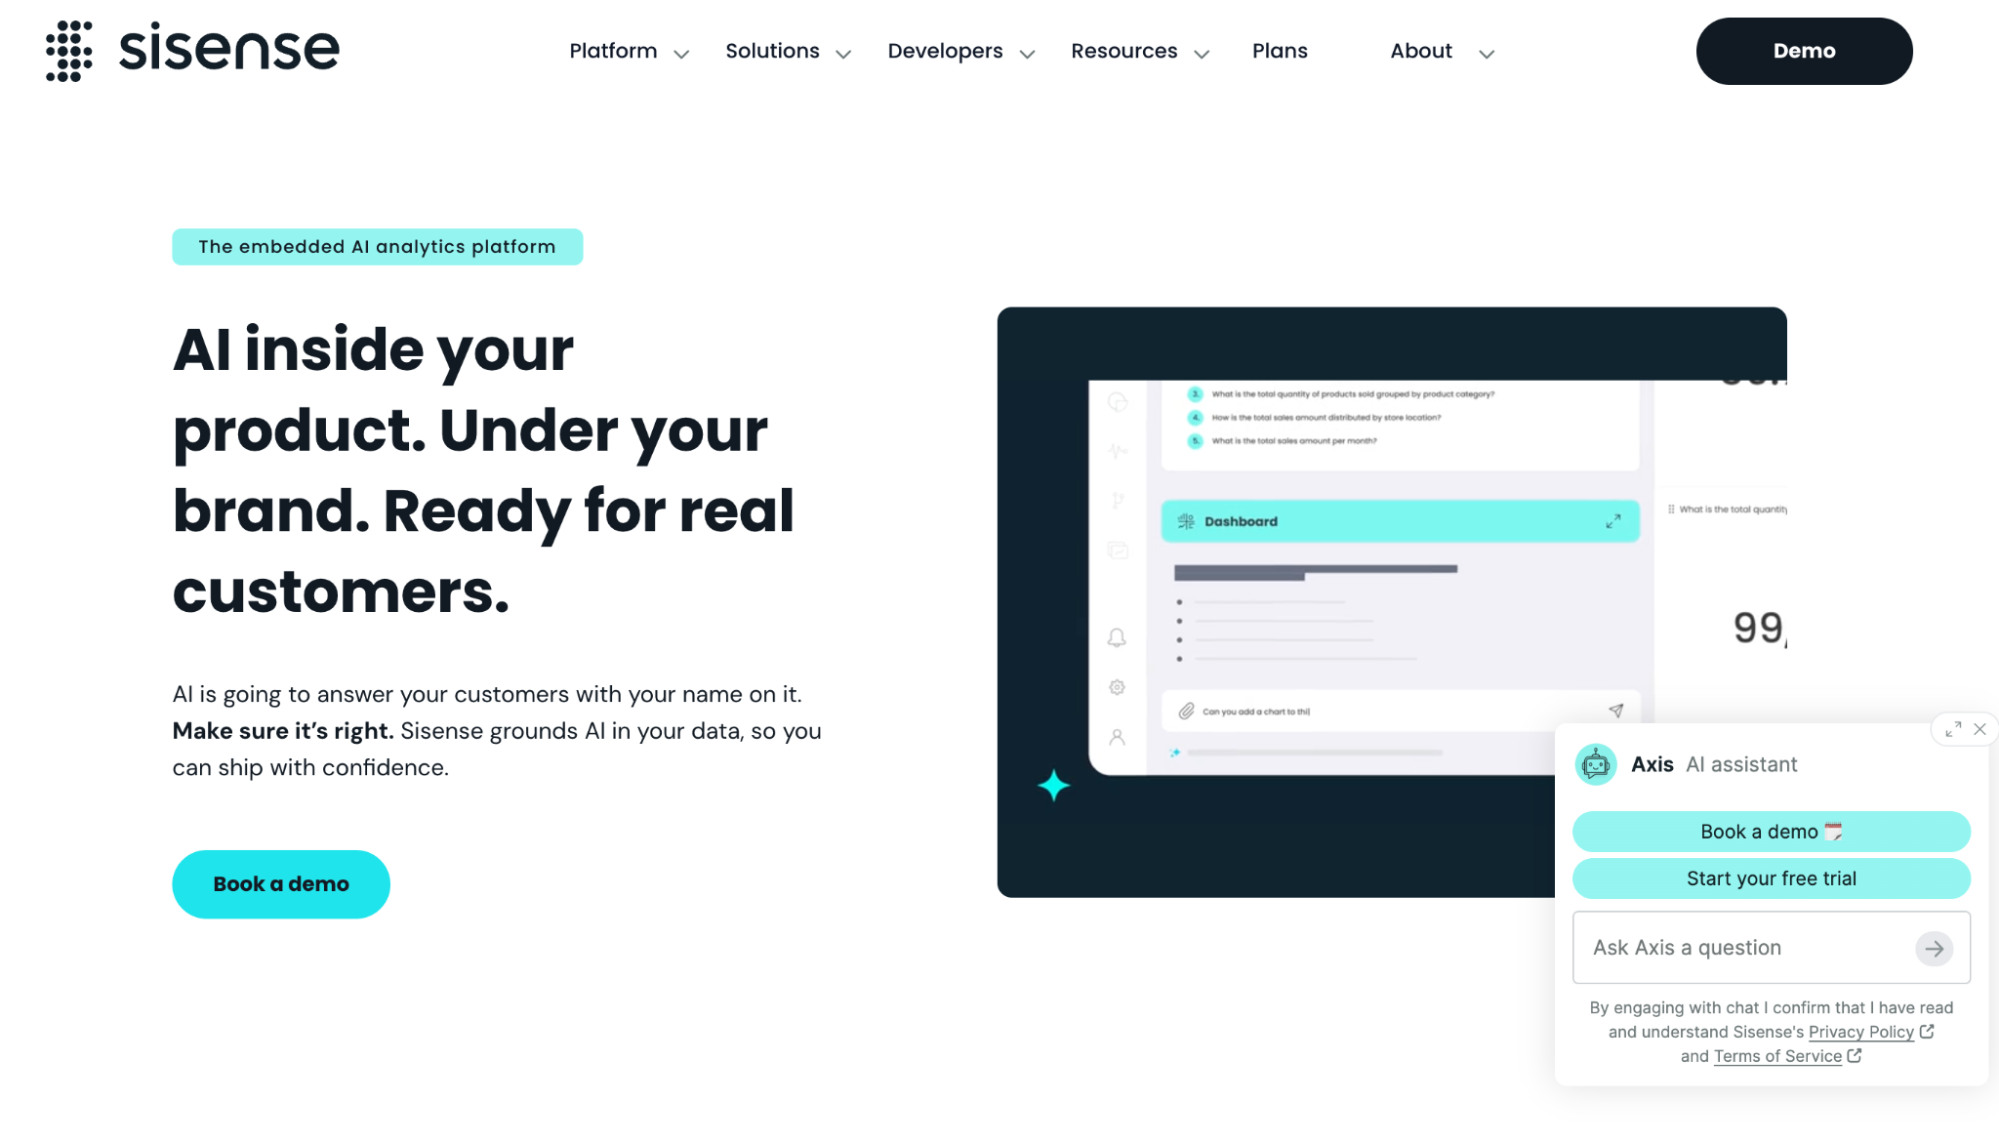
Best for: Software companies that want to embed customizable analytics inside their own products.
Sisense is an analytics platform known for embedded analytics, letting companies build dashboards and data features into the apps their customers use. It suits product and engineering teams that have the developers to model data, customize widgets with code, and maintain the integration. Setting up data models like ElastiCubes gets complex as data grows, and reviewers mention slow cube builds under heavy data loads, so it needs ongoing technical ownership.
Key features
- Embedded analytics and Compose SDK: Embed dashboards and analytics components into your own applications.
- ElastiCube and Live data models: Import and transform data into ElastiCube models for fast querying.
- Code-level customization: Add JavaScript at the dashboard and widget level to change how visuals behave and interact.
- Multi-tenant security: Support tenant-safe access and row-level security so each customer or user sees only their own data.
Pros
- The Compose SDK and integration features give developers much more control than typical BI tools (Paul V N., G2)
- Visualizations are clear and quick to build, and dashboards can be shared or sent automatically by email (Verified User in Automotive, G2)
Cons
- ElastiCube builds perform poorly under heavy data loads (Darragh M., G2)
What to look for when choosing a ThoughtSpot alternative
If you lead marketing, CRM, or customer insights, the right alternative should help your team move from question to action quickly. Here’s what to evaluate:
- Ease of use for non-technical teams: Business users should be able to ask questions and get reliable answers, without writing SQL, sitting through lengthy training, or waiting on the data team.
- Understanding of customer and campaign data: Look for tools that work with customer behavior, segments, loyalty, and campaign results out of the box, so you don’t need custom data models before getting useful insights.
- The ability to act on insights: The best tools help you turn insights into next steps, like building a segment or launching a campaign, instead of stopping at a dashboard.
- Fast time to value: Ask how long setup takes and what a typical pilot looks like.
- Transparent AI and enterprise security: The AI should explain its recommendations and keep people in control of every decision. The tool should also meet standards like GDPR, CCPA, and ISO 27001.
Choosing the right ThoughtSpot alternative
Getting a fast answer about your customers is a great start, but for marketing, CRM, and customer insights leaders, the answer usually isn’t the finish line. What matters is how quickly that insight becomes the right audience, offer, message, and campaign.
Each tool on this list approaches that differently. Some are built for analysts creating dashboards and reports. Others are built for data teams working in code or embedding analytics into products. If your priority is closing the gap between insight and action, look for a tool that lets your team explore customer data and act on it in the same place.
That’s what aiRA is designed to do. Marketing teams can ask questions in simple language, build segments with projected value, and turn those insights into ready-to-launch campaigns, with human approval at every step.
Request a demo to see how aiRA works on your own customer data.
FAQs

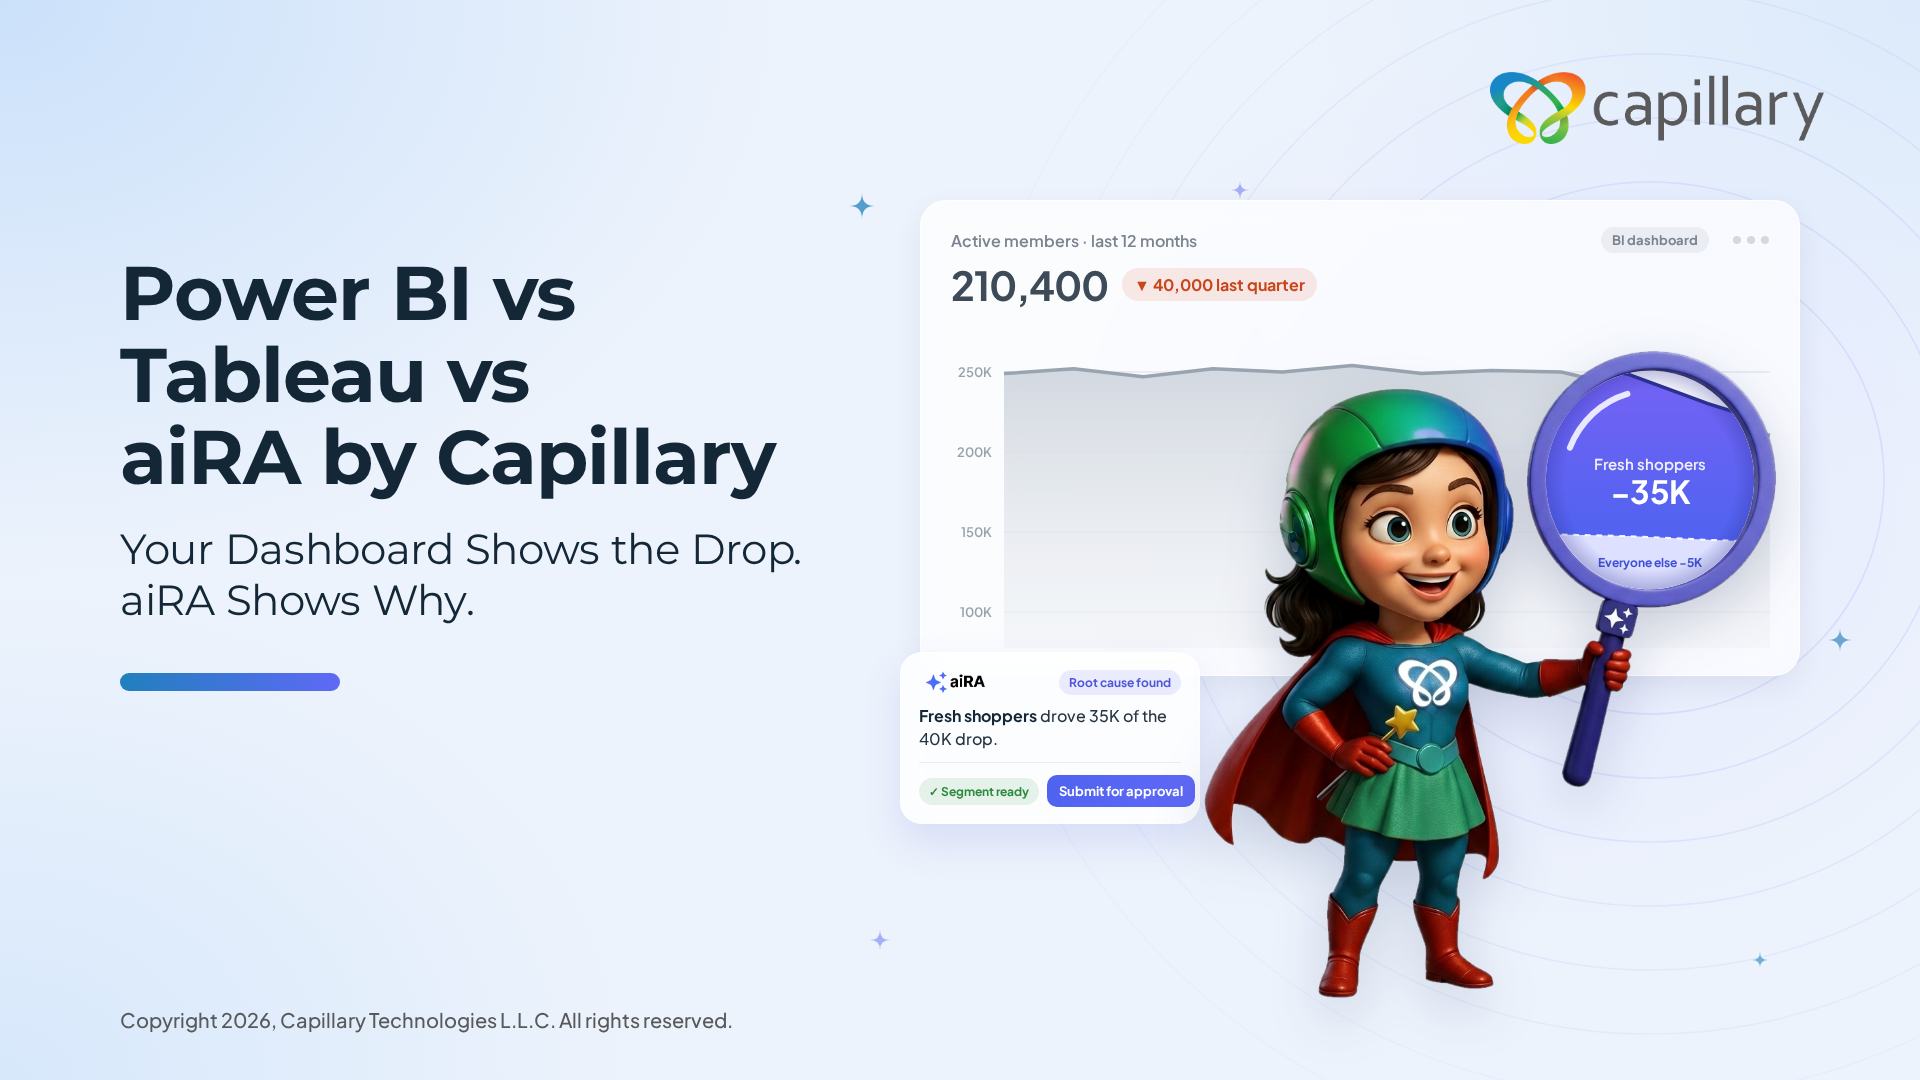
Power BI vs Tableau vs aiRA
Your Dashboard Shows the Drop. aiRA Shows Why, & What to Do About It. Power
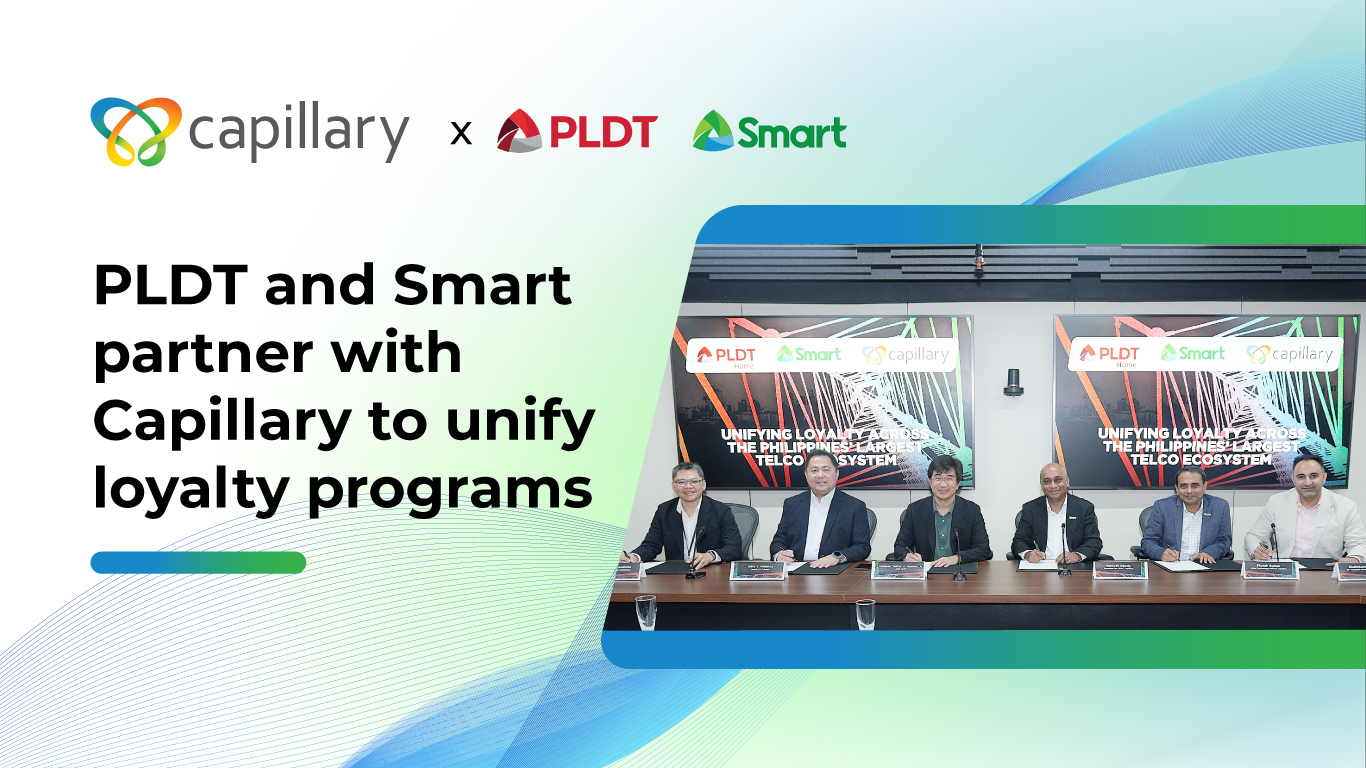
PLDT and Smart partner with Capillary to unify loyalty programs
Manila, Philippines — PLDT Inc. (PLDT) and its wireless subsidiary Smart Communications, Inc (Smart) have