
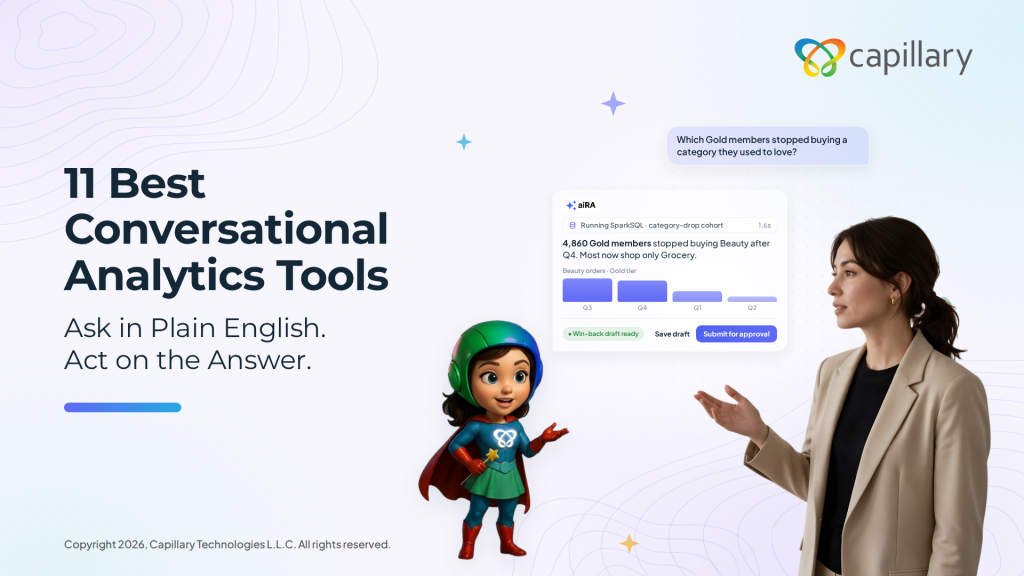
Conversational analytics tools let anyone ask a question about their data in plain English and get an answer in seconds, without writing SQL.
For marketing, CRM, and customer insights leaders, though, the answer is rarely the end of the work. Someone still has to build the audience, pick the offer, shape the message, and set up the campaign. And most tools in this category stop at a chart.
That’s why it’s worth looking closely at what each tool is actually built to do before you add it to your shortlist.
In this guide, we compare the 11 best conversational analytics tools. For each one, you’ll find who it’s best for, its key features, and pros and cons drawn from user reviews, so you can choose the right fit for your team.
Tl;dr
Based on ease of use, understanding of customer data, trust, ability to act on insights, and governance, these are the top 10 conversational analytics tools worth considering in 2026:
- aiRA by Capillary: Best overall conversational analytics tool for marketing, CRM, and customer insights teams.
- Microsoft Power BI: Best for reporting within the Microsoft 365 ecosystem.
- Tableau: Best for custom visual dashboards built by analyst teams.
- Looker: Best for governed metrics on Google Cloud.
- ThoughtSpot: Best for search-based analytics on modeled warehouse data.
- Qlik: Best for exploring complex data across many sources.
- Domo: Best for connectors, data prep, and dashboards in one cloud platform.
- Sigma: Best for spreadsheet-style analysis on live cloud warehouse data.
- Tellius: Best for explaining metric changes in pharma and CPG analytics.
- Zenlytic: Best for an AI data analyst on top of a cloud data warehouse.
- Databricks: Best for companies already running a Databricks lakehouse.
Don’t want to read the long list of tools ahead?
You can sign up for a demo of aiRA by Capillary and go from first conversation to full deployment in just 2–4 weeks.
What to look for in a conversational analytics tool
If you lead marketing, CRM, or customer insights, the right conversational analytics tool should help your team go from a question about your customers to action quickly. Here’s what to evaluate:
1. Ease of use for non-technical teams
Marketers should be able to ask questions in plain English and get useful answers in their first week. They shouldn’t have to write SQL or wait for the data team to model the data first.
2. Understanding of customer and campaign data
Look for tools that understand customer behavior, loyalty, and campaign results out of the box. The tool should already know what a lapsed customer or a redemption is, so you don’t need custom data models before getting useful insights.
3. Trust and explainability
The tool should show the query, the data sources, and the assumptions behind every answer. It’s the trust factor reviewers mention most, and it lets your team check an answer before acting on it.
4. Ability to act on insights
Most tools stop at a chart, and someone on your team still has to build the segment and set up the campaign. The best tools help you turn insights into next steps, like building a segment or launching a campaign, instead of stopping at a dashboard.
5. Enterprise security and governance
Anything customer-facing should need human approval and leave a full audit trail. Personal data should be masked before it reaches the LLM, and the tool should meet standards like GDPR, CCPA, and ISO 27001.
How this list was tested and selected
A good conversational analytics tool should let someone outside the data team ask a question about their customers and trust the answer. It shouldn’t need weeks of data modeling before it’s useful. And once you have the answer, it shouldn’t leave your team to do the rest by hand.
So we turned each of these needs into a criterion and checked every tool on this list against it. Here are the questions we asked when creating this list:
- Learning curve: Can a non-technical user get a useful answer in their first week?
- Setup: How much data modeling is needed before the first trustworthy answer?
- Trust: Does the tool show where the answer came from and how it was calculated?
- Action: Can you do something with the answer, or does the trail end at a chart?
- Governance: Is there human approval and an audit trail on anything customer-facing?
Conversational analytics tools at a glance
The 11 best conversational analytics tool
1. aiRA by Capillary
Best for: Enterprise brands that want conversational analytics built on their customer and loyalty data, not general business reporting.
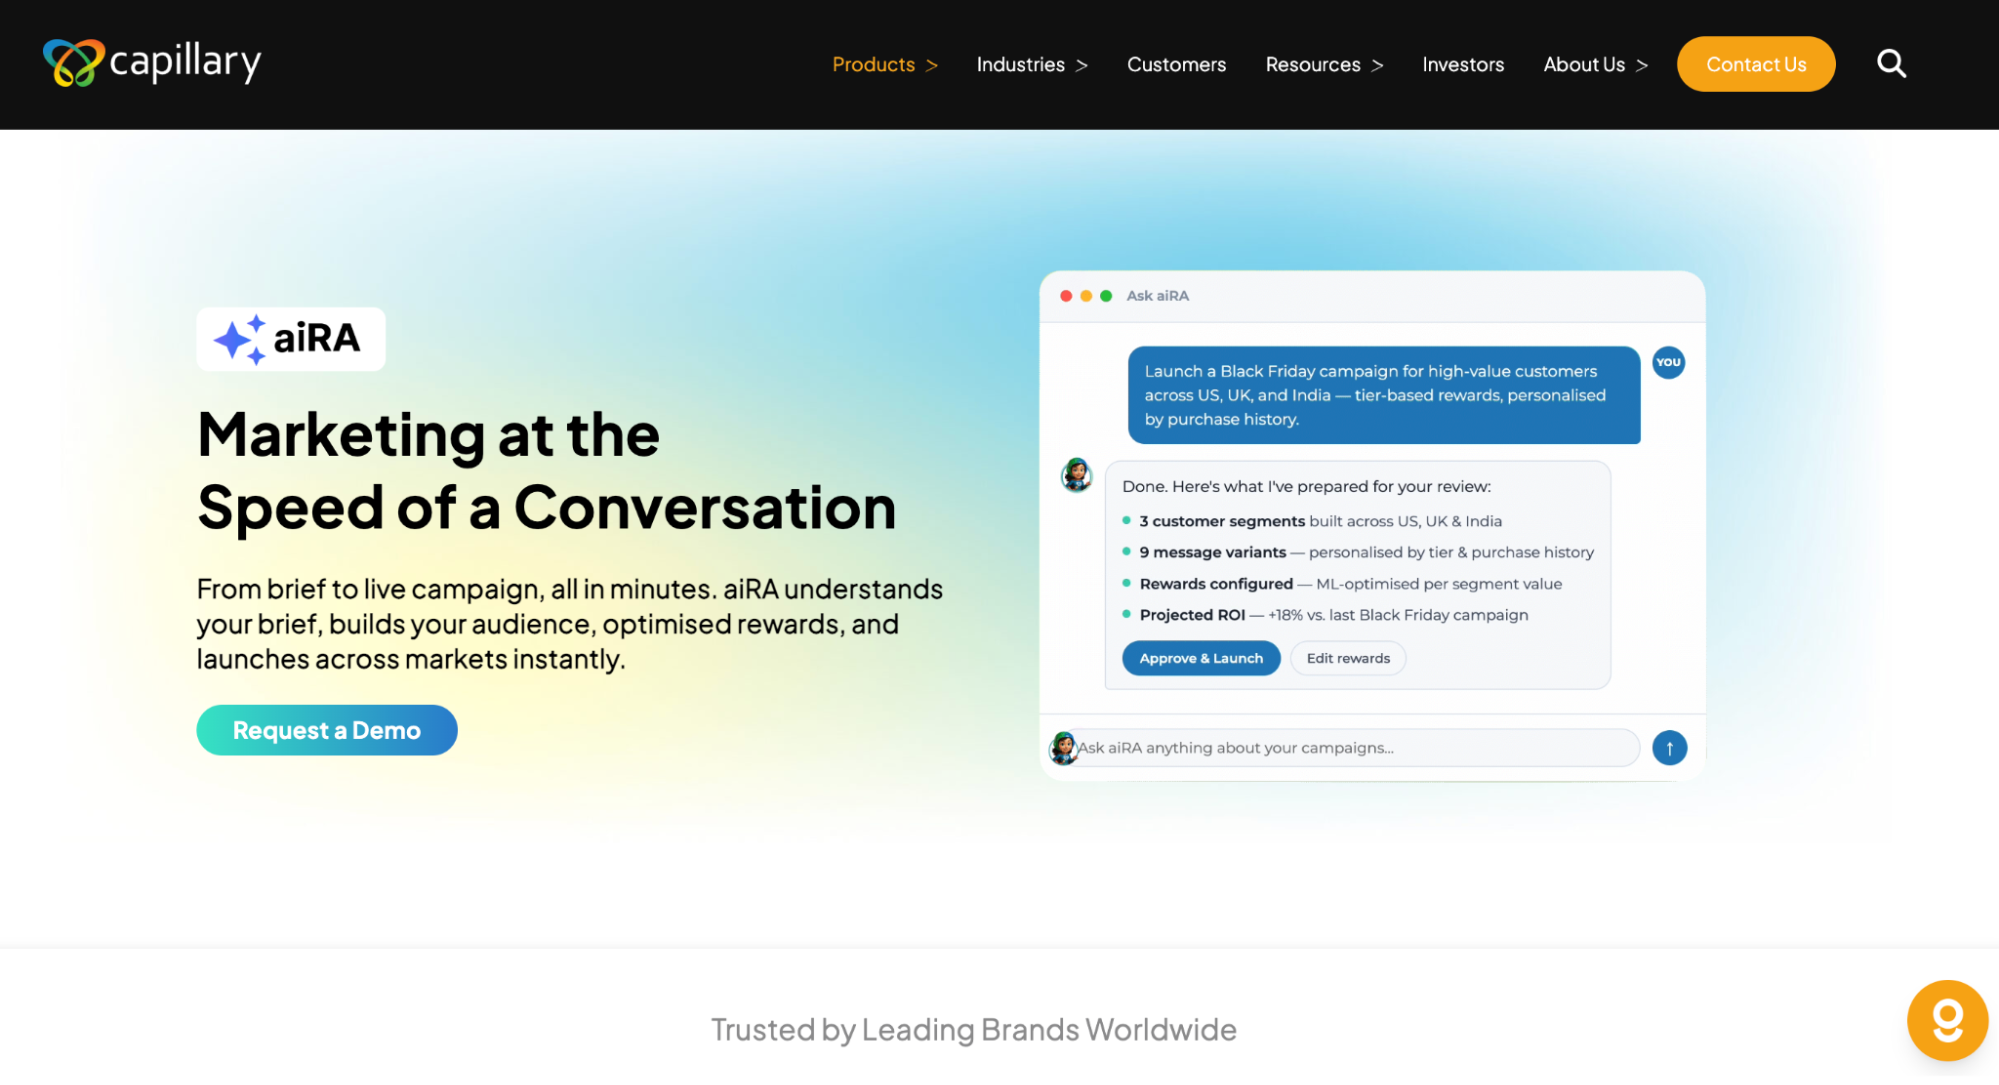
aiRA by Capillary is an agentic AI co-pilot for marketing and loyalty teams, built into the Capillary Technologies platform. You can ask questions about your customers in plain English and get answers from your brand’s own data, with no SQL and no analyst queue. From there, aiRA builds the segment, recommends offers, rewards, messaging, and channels, and sets up the campaign, with your team approving every step.
Typically, an enterprise campaign runs through five phases: strategy, segmentation, setup, launch, and measurement. This can involve 3+ teams and take 26+ days. aiRA brings all five phases into one conversation. A full deployment on your brand data takes 2–4 weeks, with a dedicated Capillary Technologies success manager throughout.
Watch this YouTube video to see how you can create a marketing campaign in aiRA
Key features
- Conversational customer analytics: Ask questions in plain English to profile customers and spot behavioral trends like seasonal patterns and engagement signals.
- Natural language segmentation: Describe an audience and aiRA builds the segment, with propensity scores and projected campaign value for each one.
- Conversational campaign creation: Set up audience, rewards, messaging, and multi-channel delivery from a single brief, localized by region and language. aiRA also recommends ML-optimized rewards, predicts ROI by market, and explains each recommendation before you approve it.
- Enterprise governance: Personal data is masked before it reaches the LLM, every AI interaction is logged, and no customer-facing action goes live without human approval. aiRA is ISO 27001 aligned and compliant with PCI DSS and GDPR/CCPA/PDPA.
Pros
- Marketing teams build their own segments and campaigns, which saves 62+ analyst hours a month
- Human approval on every customer-facing action and a full audit trail suit enterprise governance needs
Cons
- Built for enterprise marketing, CRM, and loyalty use cases so it isn’t designed for start up companies
2. Microsoft Power BI
Best for: Organizations already on Microsoft 365 that want to keep their reporting inside the Microsoft ecosystem.
Power BI is Microsoft’s business intelligence platform. Copilot adds a chat layer on top, so users can ask questions about their reports in plain English. It fits companies that already run on Excel, Teams, and SharePoint and have BI developers to maintain the data models.
Copilot only works as well as the data model behind it, so a technical team has to build that first. Deeper analysis still needs DAX. And the answers end at a report or a chart, so building the segment and launching the campaign happen elsewhere.
Key features
- Copilot in Power BI: Ask questions about your reports in plain English and get summaries and suggested visuals.
- DAX and semantic modeling: Define measures and relationships in data models that reports and Copilot draw on.
- Microsoft ecosystem integration: Analyze data in Excel and share reports in Teams and SharePoint.
Pros
- Copilot can summarize reports, answer questions about the data, and suggest visuals, which speeds up data exploration
- Works well with Excel, which makes it easy to bring existing datasets into reports
Cons
- Copilot isn’t very effective in Power BI yet, and the data cleanup tools sometimes fall short, so work goes back to Excel
3. Tableau
Best for: Analyst teams that build custom visual dashboards from many data sources.
Tableau is Salesforce’s BI platform, built around drag-and-drop visualization. Tableau Agent adds a chat layer, so users can ask questions about a dashboard in plain English. It fits companies with an analyst team that designs and maintains dashboards for everyone else.
What Tableau Agent can answer depends on the dashboards and data sources analysts have already set up. Complex calculations and data prep still need specialist skills. And the answer ends at a chart, so building the segment and launching the campaign happen in other tools.
Key features
- Tableau Agent: Ask questions about your dashboards in plain English and get answers and suggested visuals.
- Drag-and-drop visual analysis: Build charts, maps, and interactive dashboards with filters and drill-downs.
- Tableau Pulse: Follow key metrics and get digests and alerts when they change.
Pros
- The drag-and-drop interface makes it easy to explore data
- Connects to a wide range of apps and data sources
Cons
- Working with data in natural language and automating data prep both need work
4. Looker
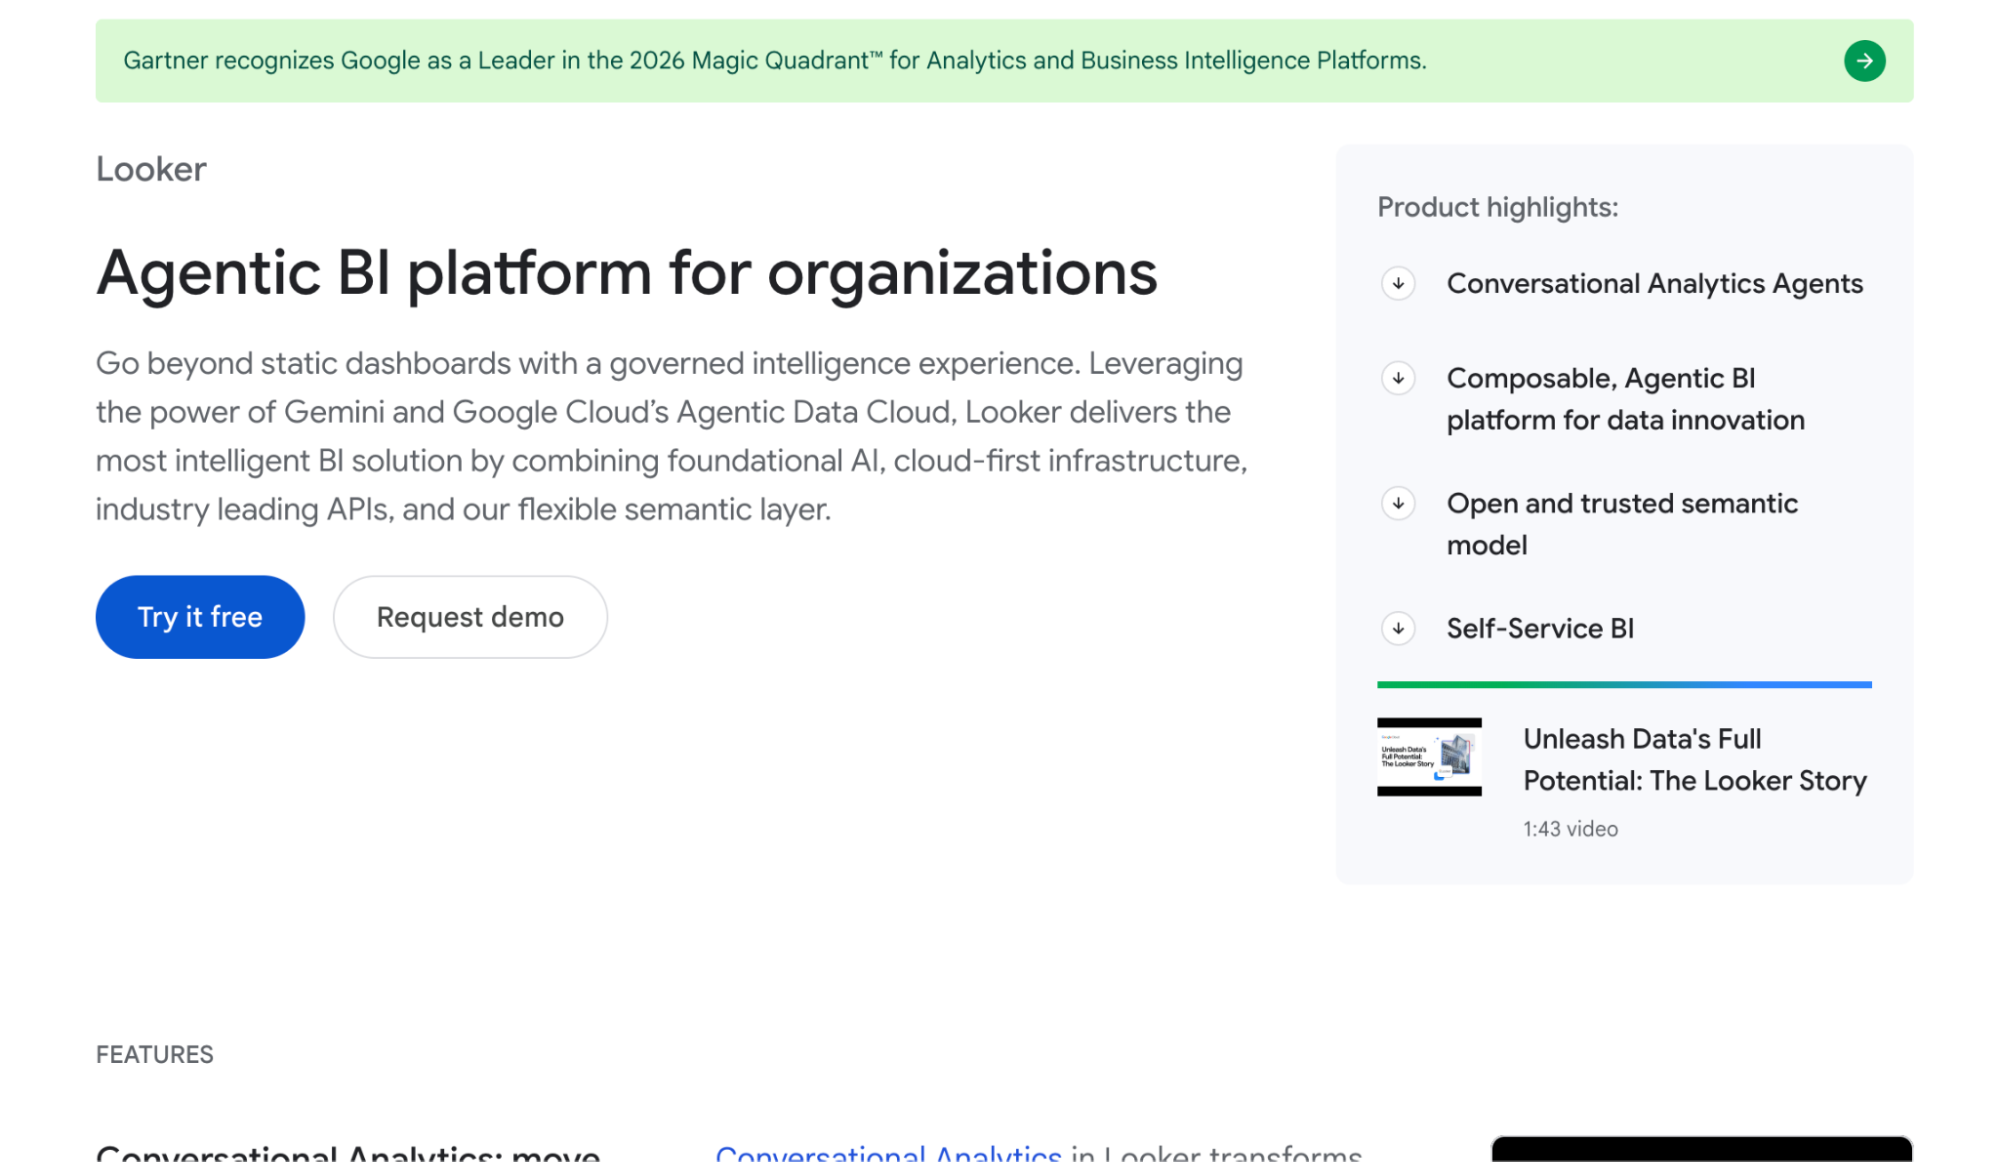
Best for: Data teams on Google Cloud that want governed metrics defined in code.
Looker is Google Cloud’s BI platform, built around LookML, a modeling language data teams use to define metrics and business logic. Its Conversational Analytics feature, powered by Gemini, lets users ask questions about that modeled data in plain English. It suits companies with dedicated data engineers and a cloud data warehouse.
Business users can only ask about data that engineers have already modeled in LookML, so new questions often wait in the data team’s queue. And the answers end at a chart or a report, so acting on them happens in other tools.
Key features
- Conversational Analytics: Ask questions about your LookML-modeled data in plain English, powered by Gemini.
- LookML semantic layer: Define KPIs, joins, and business logic in code with Git version control.
- In-database architecture: Query cloud warehouses like BigQuery and Snowflake directly without copying data.
Pros
- Brings data from different sources into one place for dashboards and tracking metrics
- Scheduled reports send the right numbers to inboxes every week without anyone running them by hand
Cons
- LookML is hard to learn, so business users depend on data engineers and have little room for quick ad hoc analysis
5. ThoughtSpot
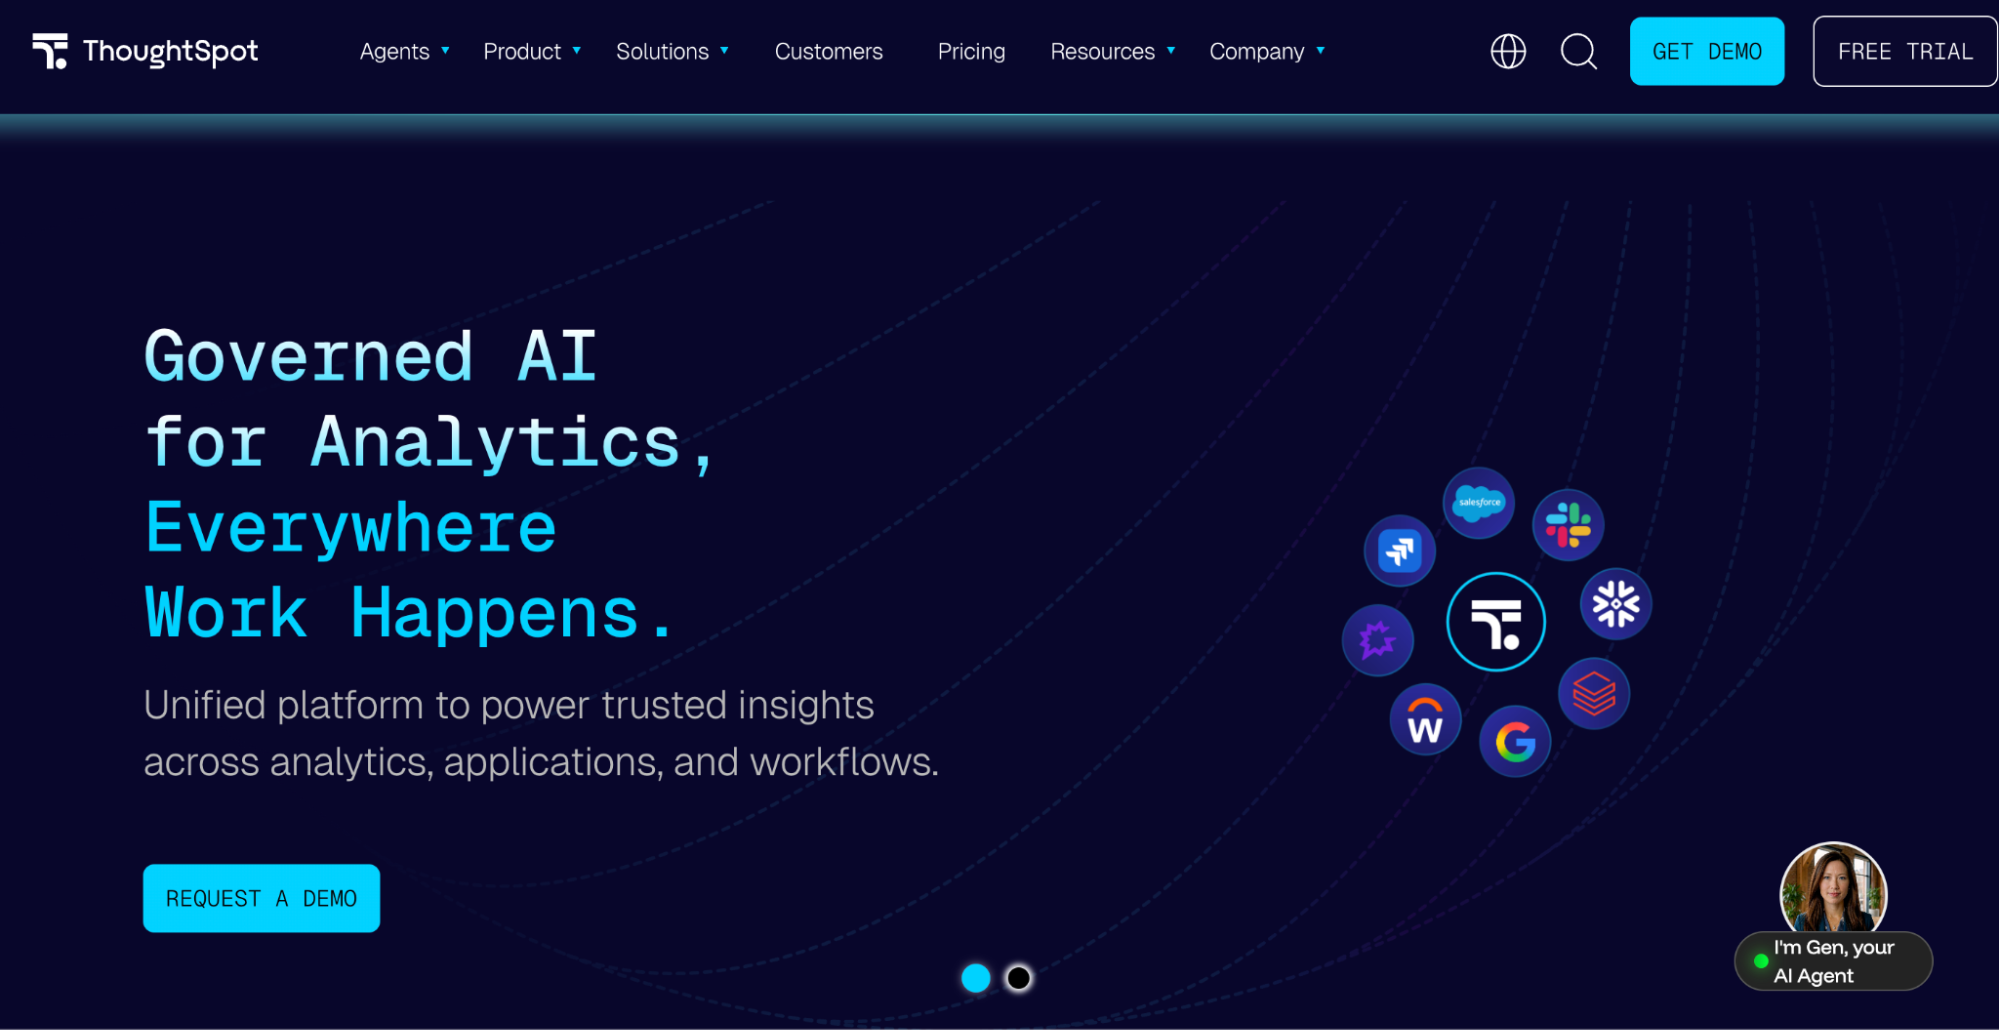
Best for: Data teams that want business users to search modeled warehouse data in plain English.
ThoughtSpot is a search-based analytics platform. Its AI analyst, Spotter, lets users ask questions in plain English and turns the answers into charts they can pin to Liveboards. It fits companies with a data team that has already modeled the warehouse.
The answers are only as good as the data models behind them, and building those models takes dimensional modeling skills. Formulas don’t follow SQL or Excel conventions, so customization comes with a learning curve. And the trail ends at a chart or a Liveboard, so the segment and campaign are built elsewhere.
Key features
- Spotter: Ask questions in plain English and follow up to drill into the answer.
- Liveboards: Pin answers to interactive dashboards and share them with your team.
- Embedded analytics: Put search and Liveboards inside your own apps and portals.
Pros
- Non-technical users can search data and build dashboards without much training
- Surfaces insights quickly once the data is set up
Cons
- Takes a long time to learn fully, and formulas are hard to build because they don’t use SQL or Excel formatting
6. Qlik
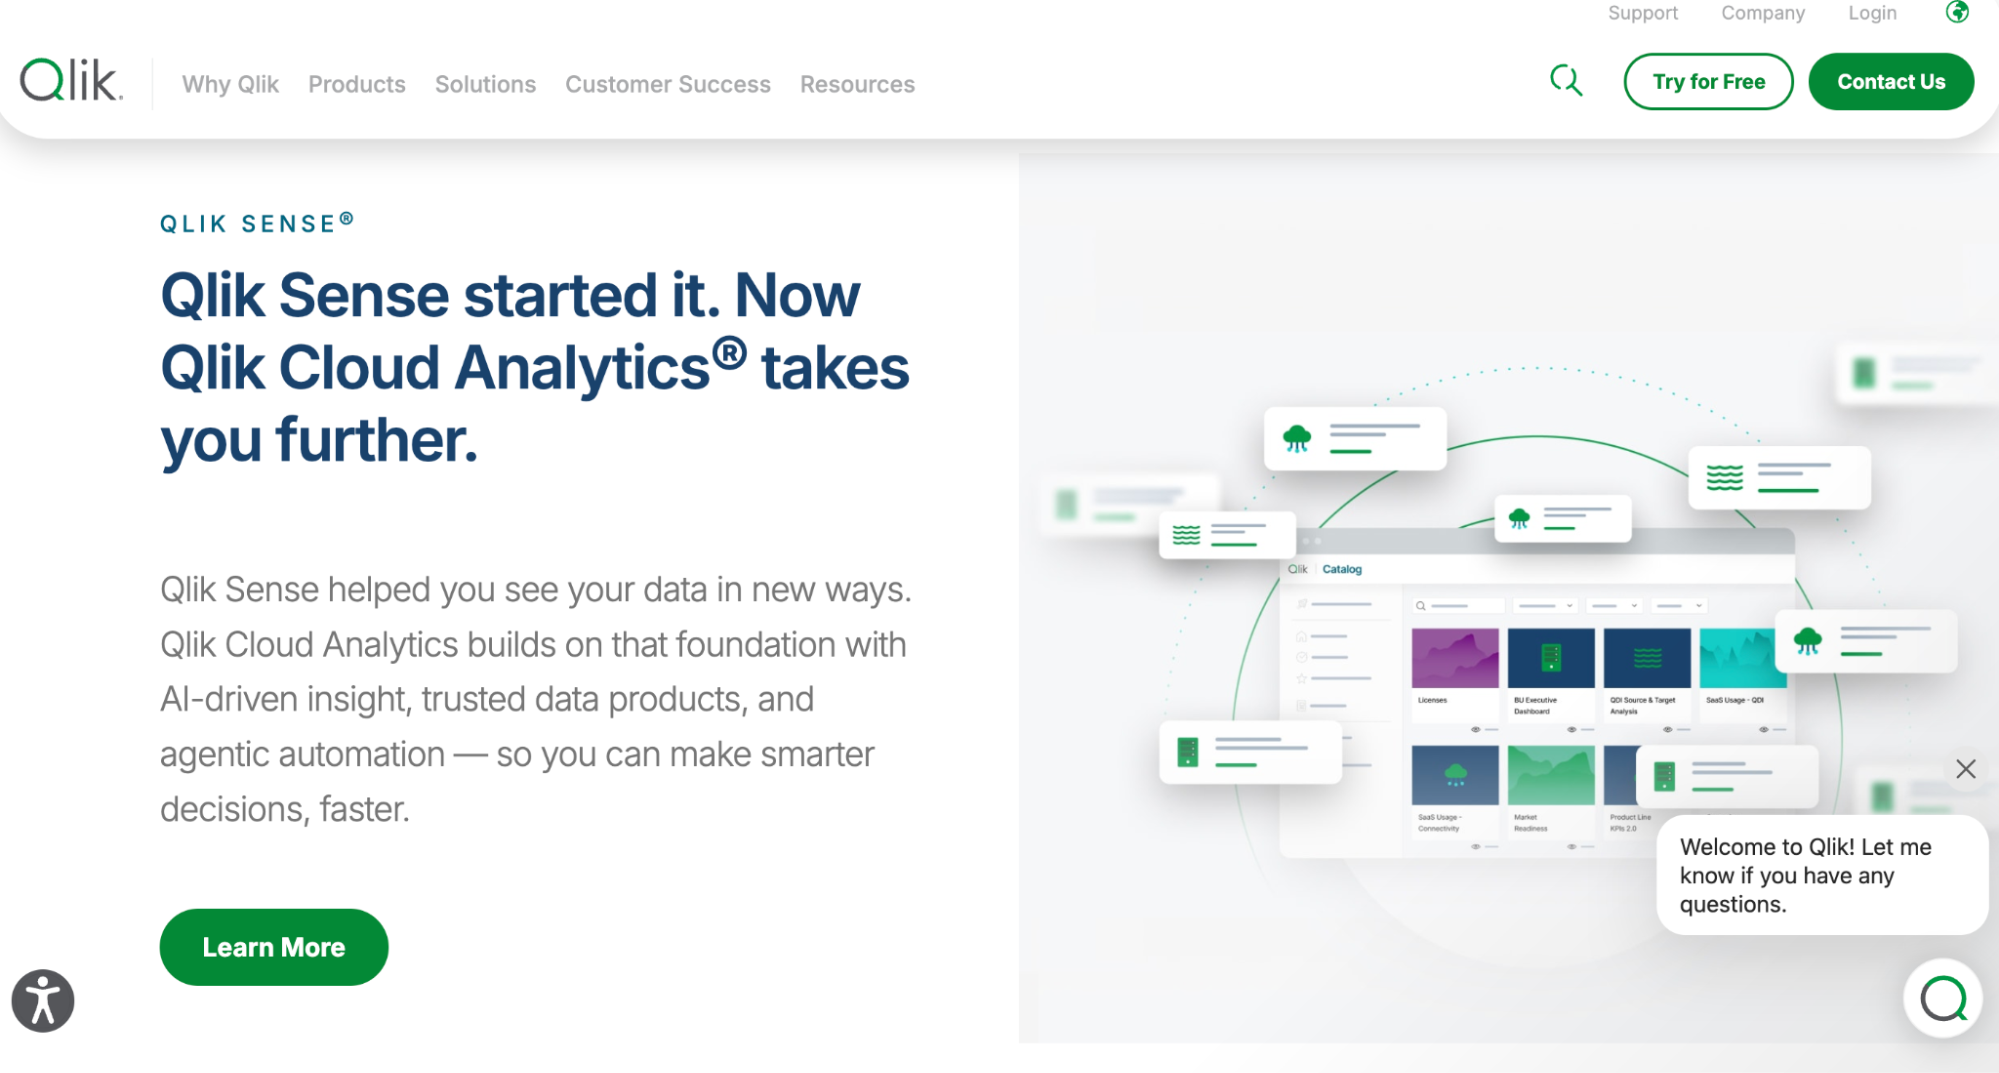
Best for: BI teams that want to freely explore complex data from many sources.
Qlik Sense is Qlik’s analytics platform, built on an associative engine that lets users click through data in any direction. Qlik Answers and Insight Advisor add a conversational layer for asking questions in plain English. It fits organizations with BI developers who build and maintain the data models.
Data has to be loaded and modeled with Qlik’s scripts before business users can explore it, and those scripts take time to learn. The answers end in a chart or an app, so acting on them happens in other tools.
Key features
- Qlik Answers: Ask questions in plain English and get answers with the sources behind them.
- Associative engine: Click any value to filter every chart at once and see related and unrelated data.
- Data load scripting and modeling: Combine and transform data from databases, SAP, cloud apps, and files.
Pros
- Handles both ETL and dashboarding in one place, so it’s easier to prepare data and then present it
- Pulls together data from many kinds of sources quickly
Cons
- It takes a lot of time to learn the script functions and data load types, which beginners find hard
7. Domo
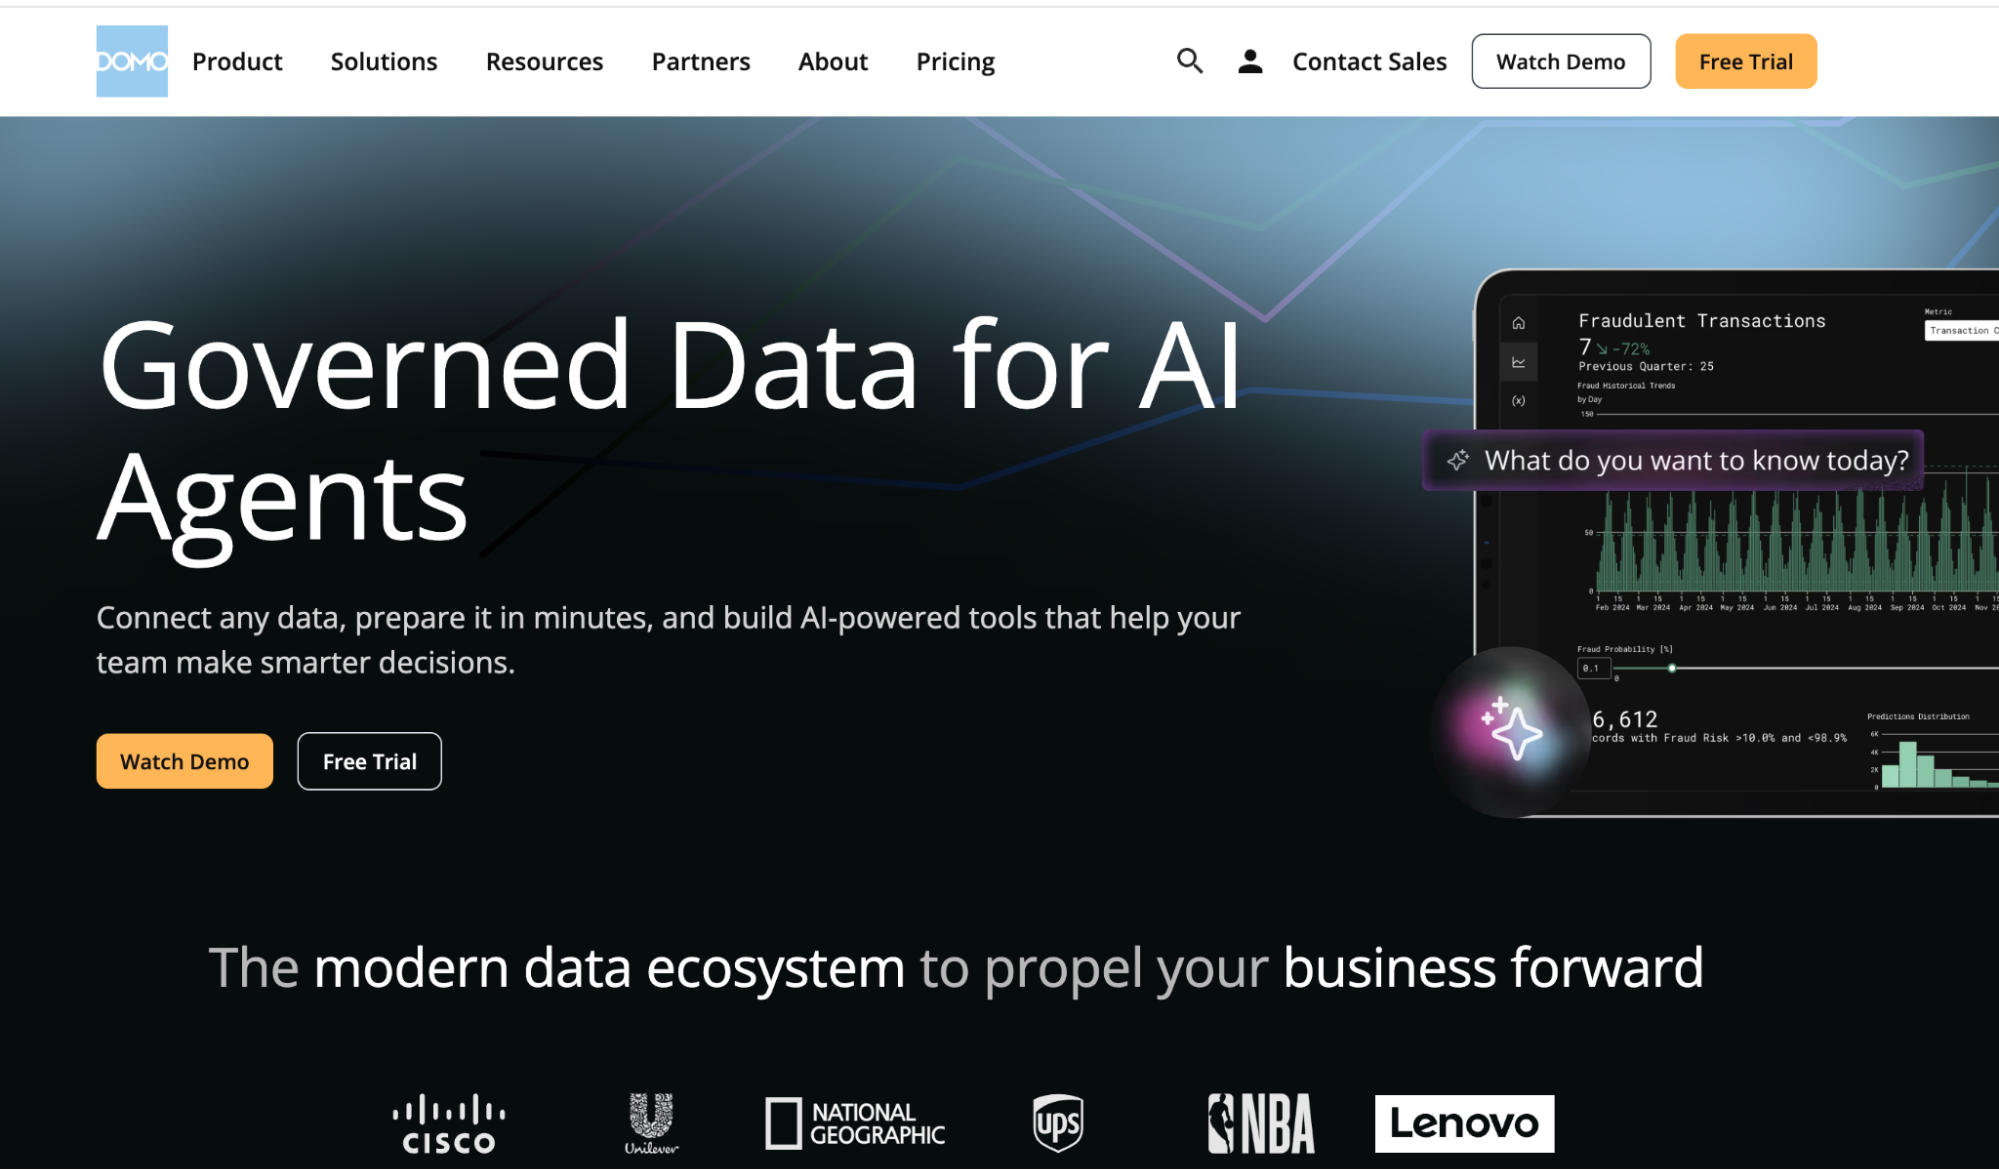
Best for: Mid-size and large companies that want connectors, data prep, and dashboards in one cloud platform.
Domo is a cloud BI platform that combines data integration, transformation, and visualization. Domo AI adds a chat experience, so users can ask questions about their data in plain English. It fits companies that pull data from many business systems, with a BI team building the pipelines and dashboards.
Day to day, the BI team usually runs Domo, and pricing based on users and data volume can get hard to predict as more people join. The answers end at a card or a dashboard, so the segment and campaign are built elsewhere.
Key features
- Domo AI Chat: Ask questions about your data in plain English and get charts and summaries.
- Prebuilt data connectors: Pull data from ERPs, CRMs, ad platforms, databases, and spreadsheets.
- Magic ETL: Clean, join, and transform datasets with a drag-and-drop pipeline builder.
Pros
- Builds metric dashboards and integrates with ERP and SaaS products
- Fast, powerful data transformations with a very broad range of data connections
Cons
- The interface isn’t intuitive, and moving between boards and projects can feel jumbled
8. Sigma
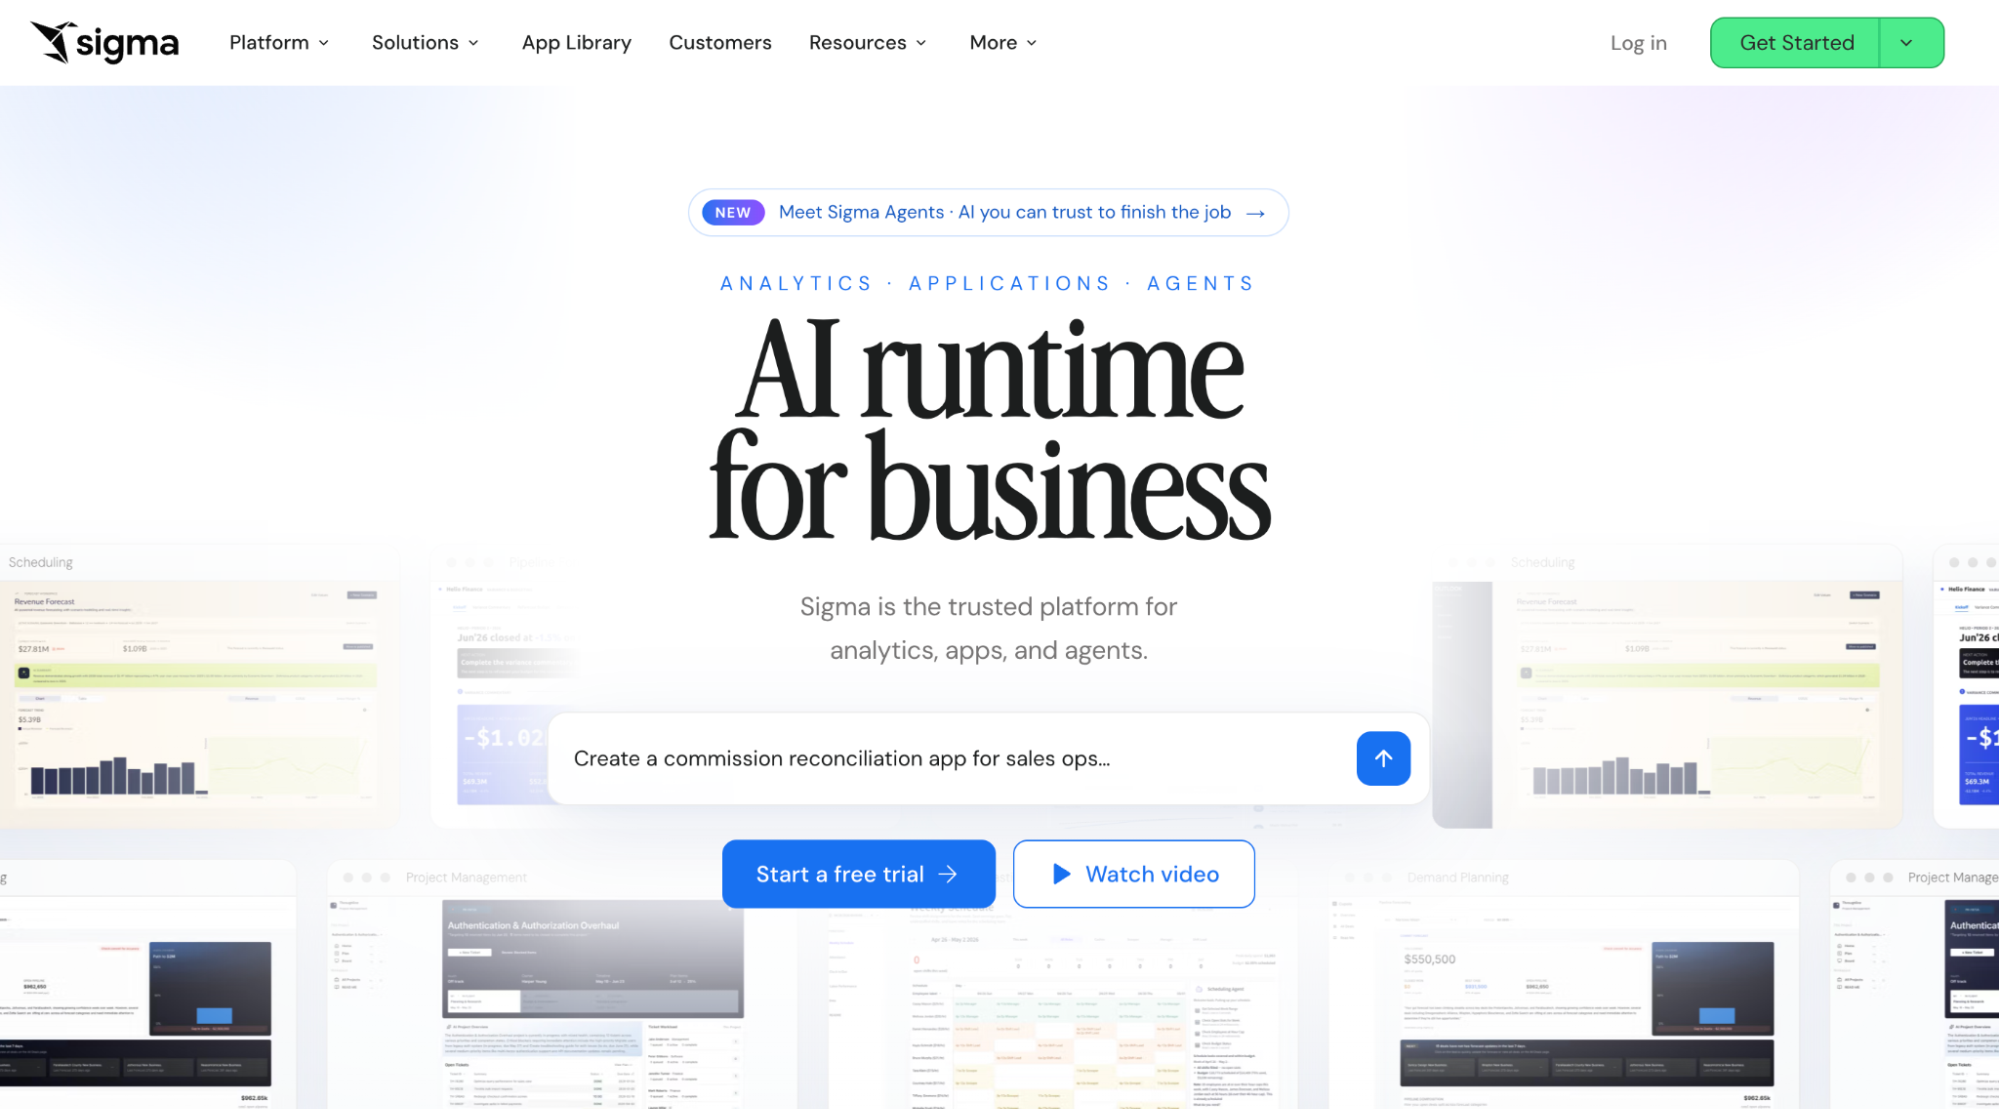
Best for: Data teams on Snowflake or other cloud warehouses that want spreadsheet-style analysis on live data.
Sigma is a cloud analytics platform with a spreadsheet-like interface that queries the data warehouse directly. Ask Sigma lets users ask questions in plain English and see the steps behind each answer. It suits companies that have already centralized data in Snowflake, BigQuery, or Databricks.
Someone still has to set up the warehouse, datasets, and permissions first, and new users need time to learn the workbook model. The answers end in a workbook or a dashboard, so acting on them happens in other tools.
Key features
- Ask Sigma: Ask questions in plain English and see the steps used to reach the answer.
- Spreadsheet-like workbooks: Sort, filter, and write formulas on live warehouse data in a familiar grid.
- Input tables: Add or edit data straight into the warehouse from a workbook for planning.
Pros
- Building dashboards is easy, and the UI elements are more polished than in other tools
- Easy to embed, and edits made in the UI save back to the data store
Cons
- Gets laggy when workbooks have many elements or large datasets, and advanced features aren’t intuitive at first
9. Tellius
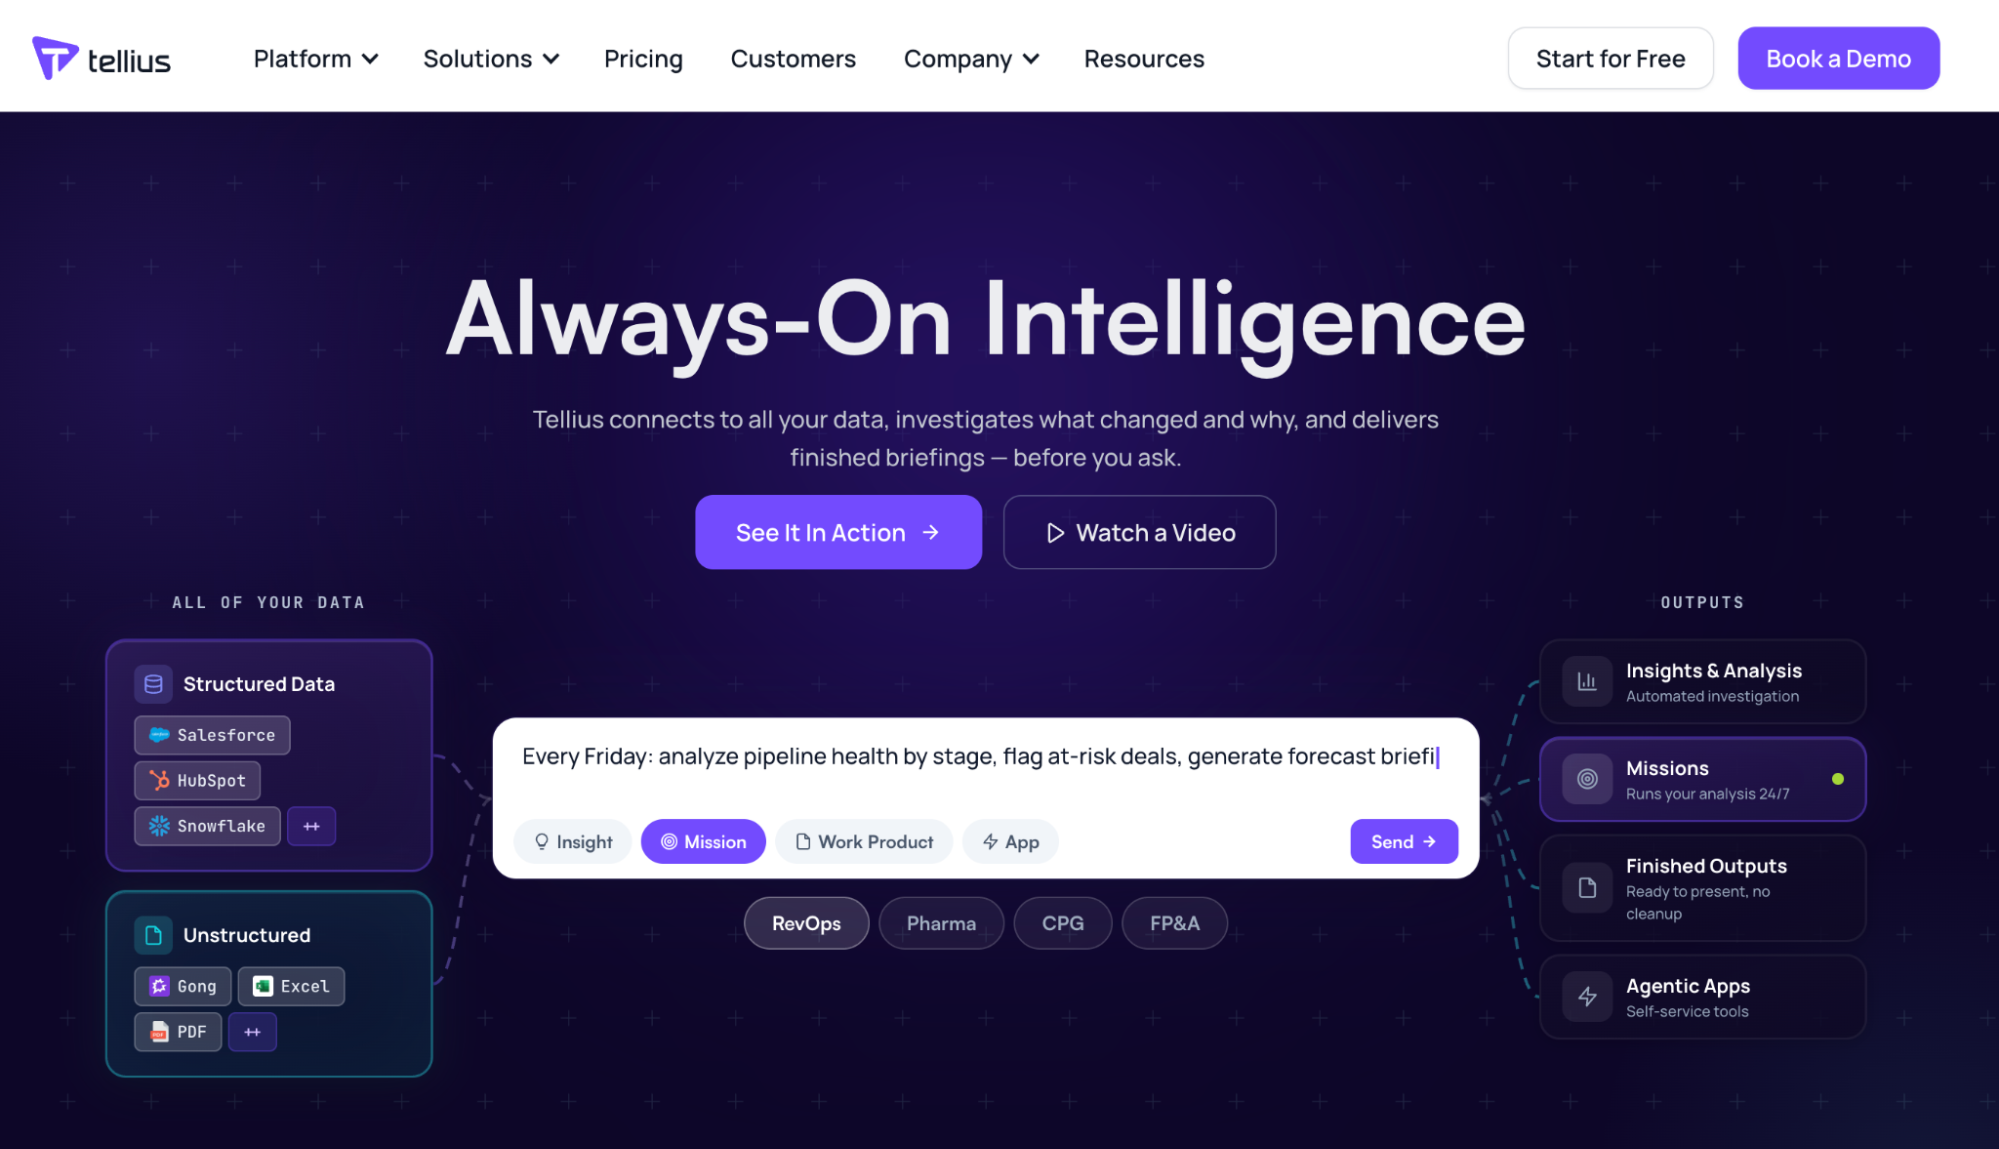
Best for: Pharma and CPG analytics teams that want AI to explain why their metrics changed.
Tellius is an agentic analytics platform. Its AI assistant, Kaiya, answers questions in plain English and runs automated root cause analysis on metrics in your warehouse. It’s used most by commercial analytics and FP&A teams in pharma and consumer goods.
Kaiya works from Business Views that a data team has to set up first. Its strength is explaining metric changes rather than working with customer and campaign data. Findings arrive as insights and reports, so building segments and launching campaigns happens elsewhere.
Key features
- Kaiya: Ask questions in plain English and follow up in a conversation.
- Automated root cause analysis: See which factors drove a change in a metric.
- Proactive monitoring: Get alerts when key metrics change, in Slack, Teams, or the browser.
Pros
- Natural language search makes it easy for business users to explore data
- Automated insights save time on finding what drove a change
Cons
- Setting up data and Business Views takes technical effort, and the interface takes time to learn
10. Zenlytic
Best for: Data teams that want an AI analyst on top of their cloud data warehouse.
Zenlytic is a BI platform built around Zoë, an AI data analyst that answers questions in plain English and shows how each answer was calculated. It connects to cloud warehouses like Snowflake, BigQuery, and Databricks, and builds a semantic model in the background as users ask questions.
Your data has to be in a cloud warehouse first. Zoë learns definitions from your own schema, so it doesn’t come with built-in knowledge of loyalty or campaign data. The answers end in analyses, dashboards, and reports, so the segment and campaign are built in other tools.
Key features
- Zoë AI data analyst: Ask questions in plain English and get charts, tables, and written analyses.
- Explainable answers: See the query and business logic behind every result.
- Governed semantic layer: Review and promote new definitions through Git-based workflows.
Pros
- Gives business users a range of insights quickly without writing SQL
- Shows the reasoning behind each answer, so results are easy to verify
Cons
- Customization options are limited, and a few design details need polish
11. Databricks AI/BI Genie
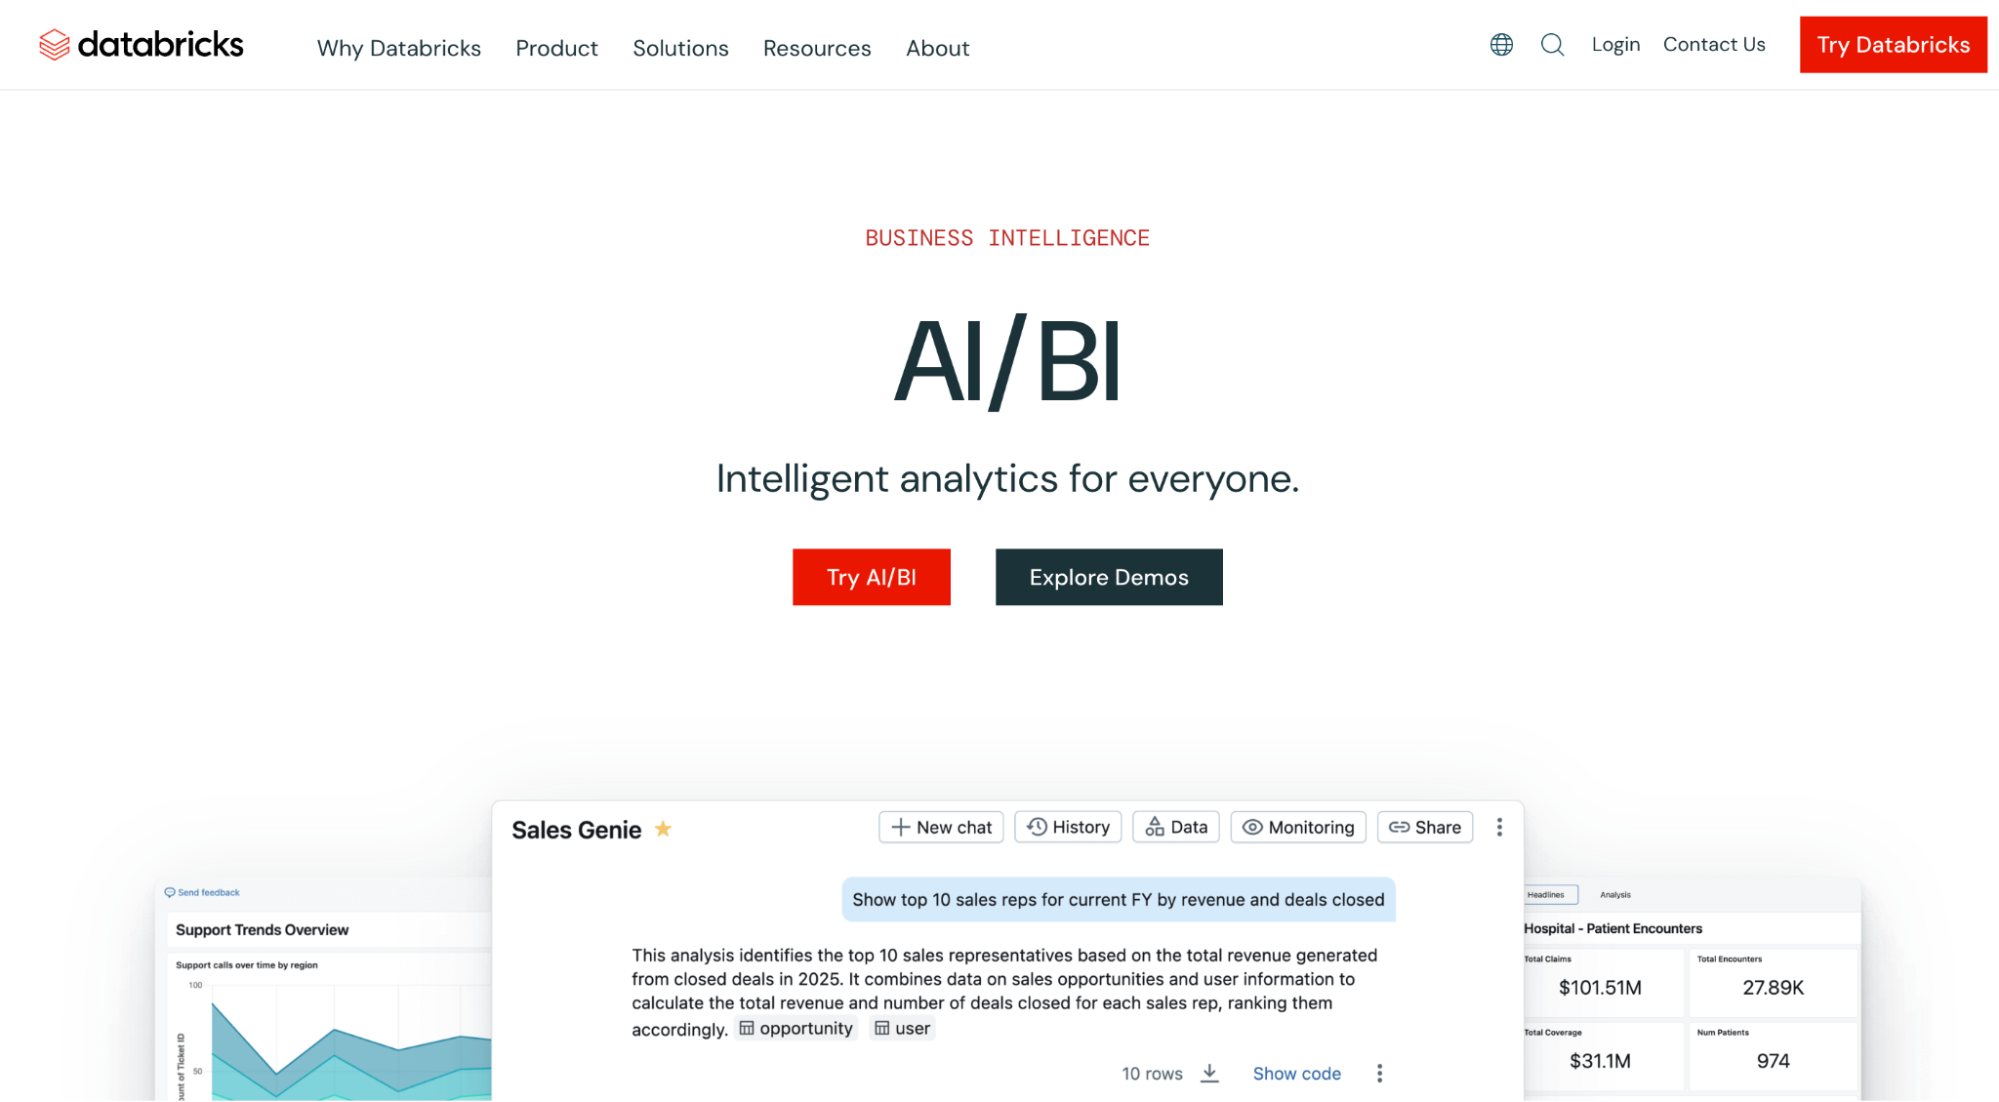
Best for: Companies already running a Databricks lakehouse that want business users to ask questions of governed data in plain English.
Genie is Databricks’ conversational analytics tool, part of its AI/BI suite. Business users ask questions in plain English and get answers backed by SQL, drawn from data governed in Unity Catalog. It fits companies that have already centralized their data in Databricks and have analysts to set up Genie Spaces for each team.
Genie is only as good as the Genie Spaces behind it, so analysts have to curate the tables, metric definitions, and sample queries first. Companies without an established lakehouse face significant setup work. And the answers end at a chart, a table, or a dashboard, so building the segment and launching the campaign happen in other tools.
Key features
- Genie: Ask questions in plain English and get answers with the SQL behind them.
- Genie Spaces: Analysts set up domain-specific spaces with verified metrics, sample queries, and business terms.
- Unity Catalog governance: Existing permissions and data lineage apply to every answer Genie gives.
Pros
- Business users can ask plain-English questions of curated data, which cuts down ad hoc requests to the data team
- Brings data engineering, analytics, and machine learning into one platform
Cons
- Genie can struggle with complex multi-table logic or domain-specific terms without tuning, and the wider platform has a steep learning curve
The ROI of conversational analytics tools for marketing and CRM teams
The right conversational analytics tool pays off in more than faster answers. Here’s where marketing and CRM teams see the return:
1. Less time waiting on analysts
When marketers can ask questions about their customers in plain English, they don’t have to file a request and wait days for a report. Analysts spend less time on one-off data pulls and more time on the work that needs their expertise.
2. Faster campaign turnaround
The gap between spotting an opportunity and launching a campaign shrinks when the insight, the segment, and the campaign setup all happen in one place. So you can respond to a drop in engagement or a seasonal trend while it still matters.
3. More relevant targeting
Segments built on real purchase behavior, engagement, and propensity scores reach the customers most likely to respond. Instead of sending one campaign to your whole base, you send the right offer to the right group, which lifts response rates and cuts wasted spend.
4. Lower analyst and agency costs
When your team can build segments and run analysis on its own, you rely less on outside agencies and extra analyst headcount for routine campaign work. That budget can go back into the campaigns themselves.
Case study: US healthcare provider with 90+ partner organizations
A leading US healthcare provider with 120M end customers ran loyalty programs across more than 90 partner organizations, each with its own requirements. Setting up each one took 16–20 specialists around three months per cycle, with full QA on every configuration, so the program couldn’t scale.
aiRA turned each partner’s requirements into a structured plan, checked it, and set up the programs automatically.
- Configuration effort cut by 75%, from 90 days to 21
- Scaled from 1 to 90+ partner organizations at the same time
- 99.9% accuracy, with manual errors reduced to zero
- Labor reduced by 80%, from 20 specialists to 4
- 8,000+ promotions launched at the start of the year, and 200+ every month since
Want similar results?
Request a demo to see how aiRA works on your own brand data.
Choosing the right conversational analytics tool
A quick answer about your customers is useful. But for marketing, CRM, and customer insights leaders, the real value comes from what happens next: how fast that answer turns into the right audience, offer, message, and campaign.
Each tool on this list handles that differently. Some are built for analysts creating dashboards and reports. Others are built for data teams modeling metrics in a warehouse. If your priority is closing the gap between a question and a campaign, look for a tool that lets your team ask, segment, and act in the same place.
That’s what aiRA is designed to do. Marketing teams can ask questions in plain English, build segments with projected value, and turn those insights into ready-to-launch campaigns, with human approval at every step.
Request a demo to see how aiRA works on your own customer data.
FAQs

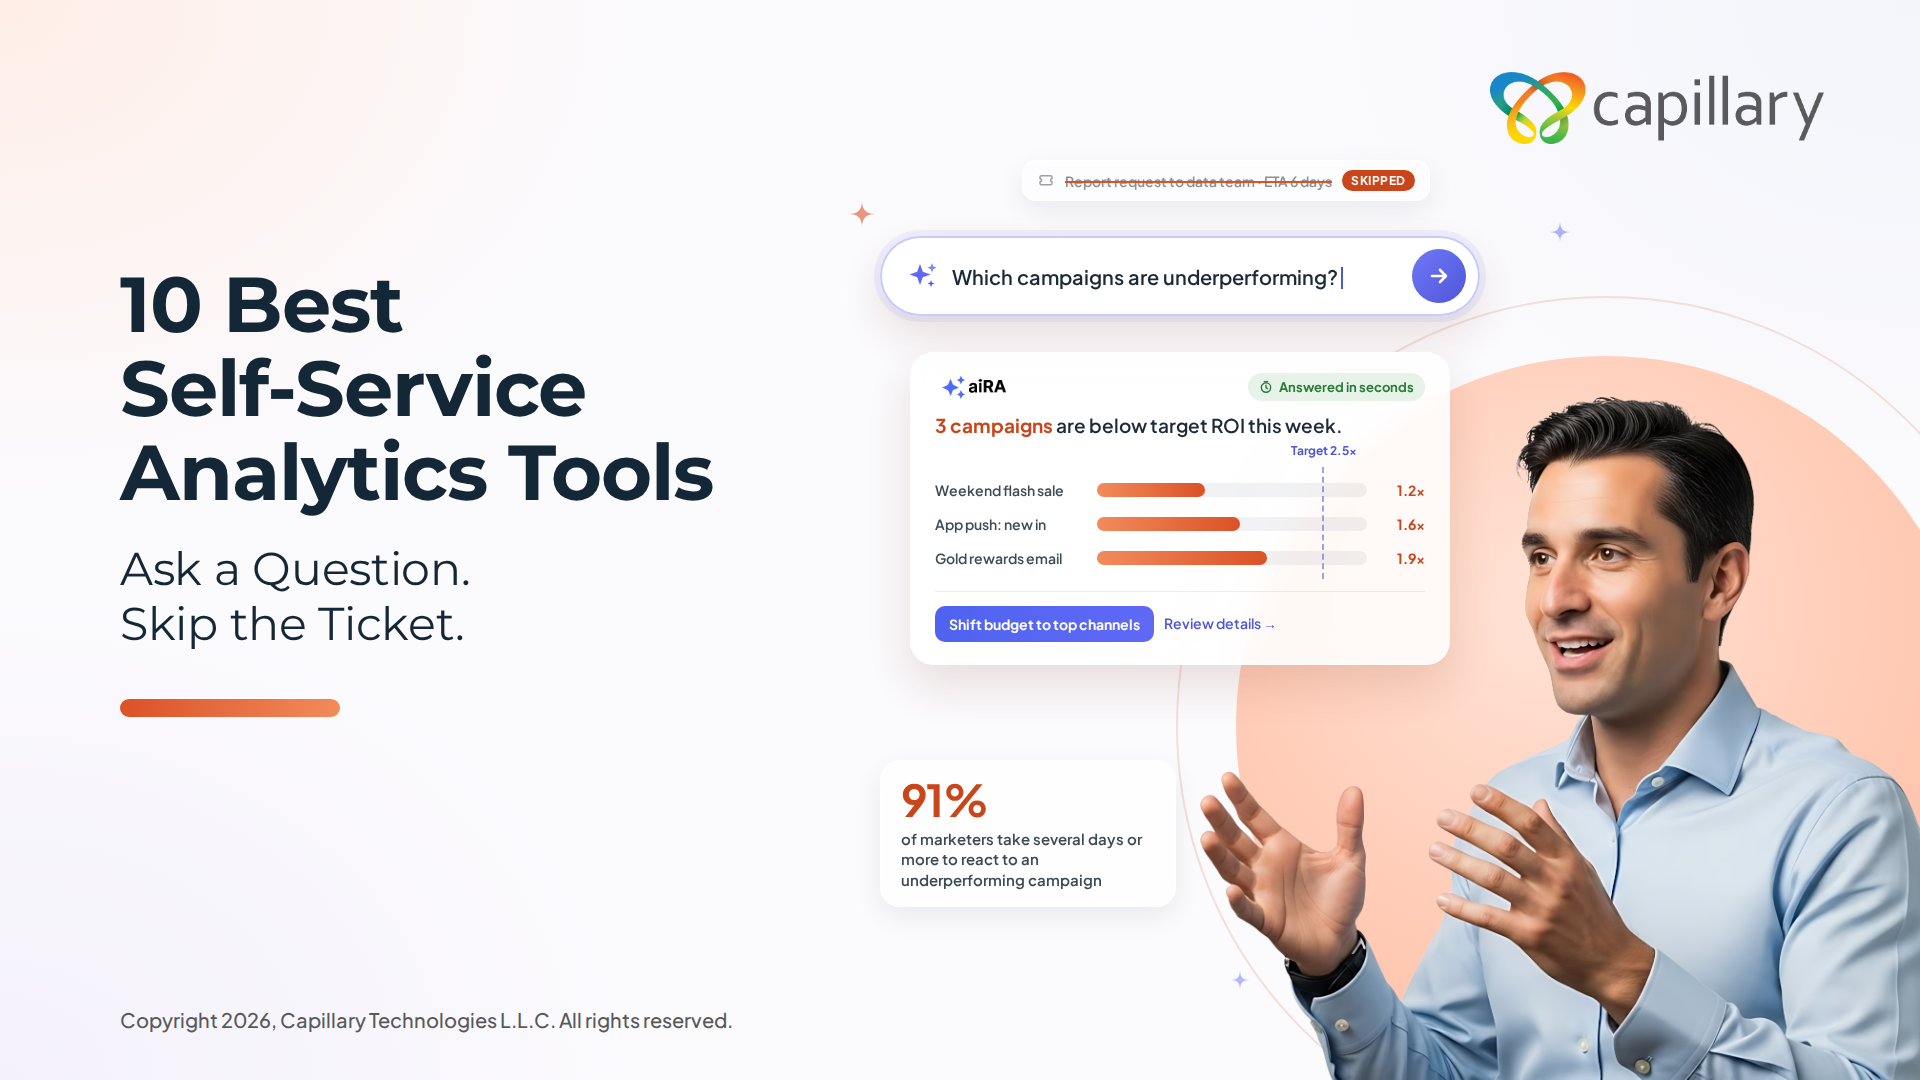
10 Best Self-Service Analytics Tools for Marketers and Business Teams in 2026
Marketing teams run on data, but getting a straight answer out of that data is
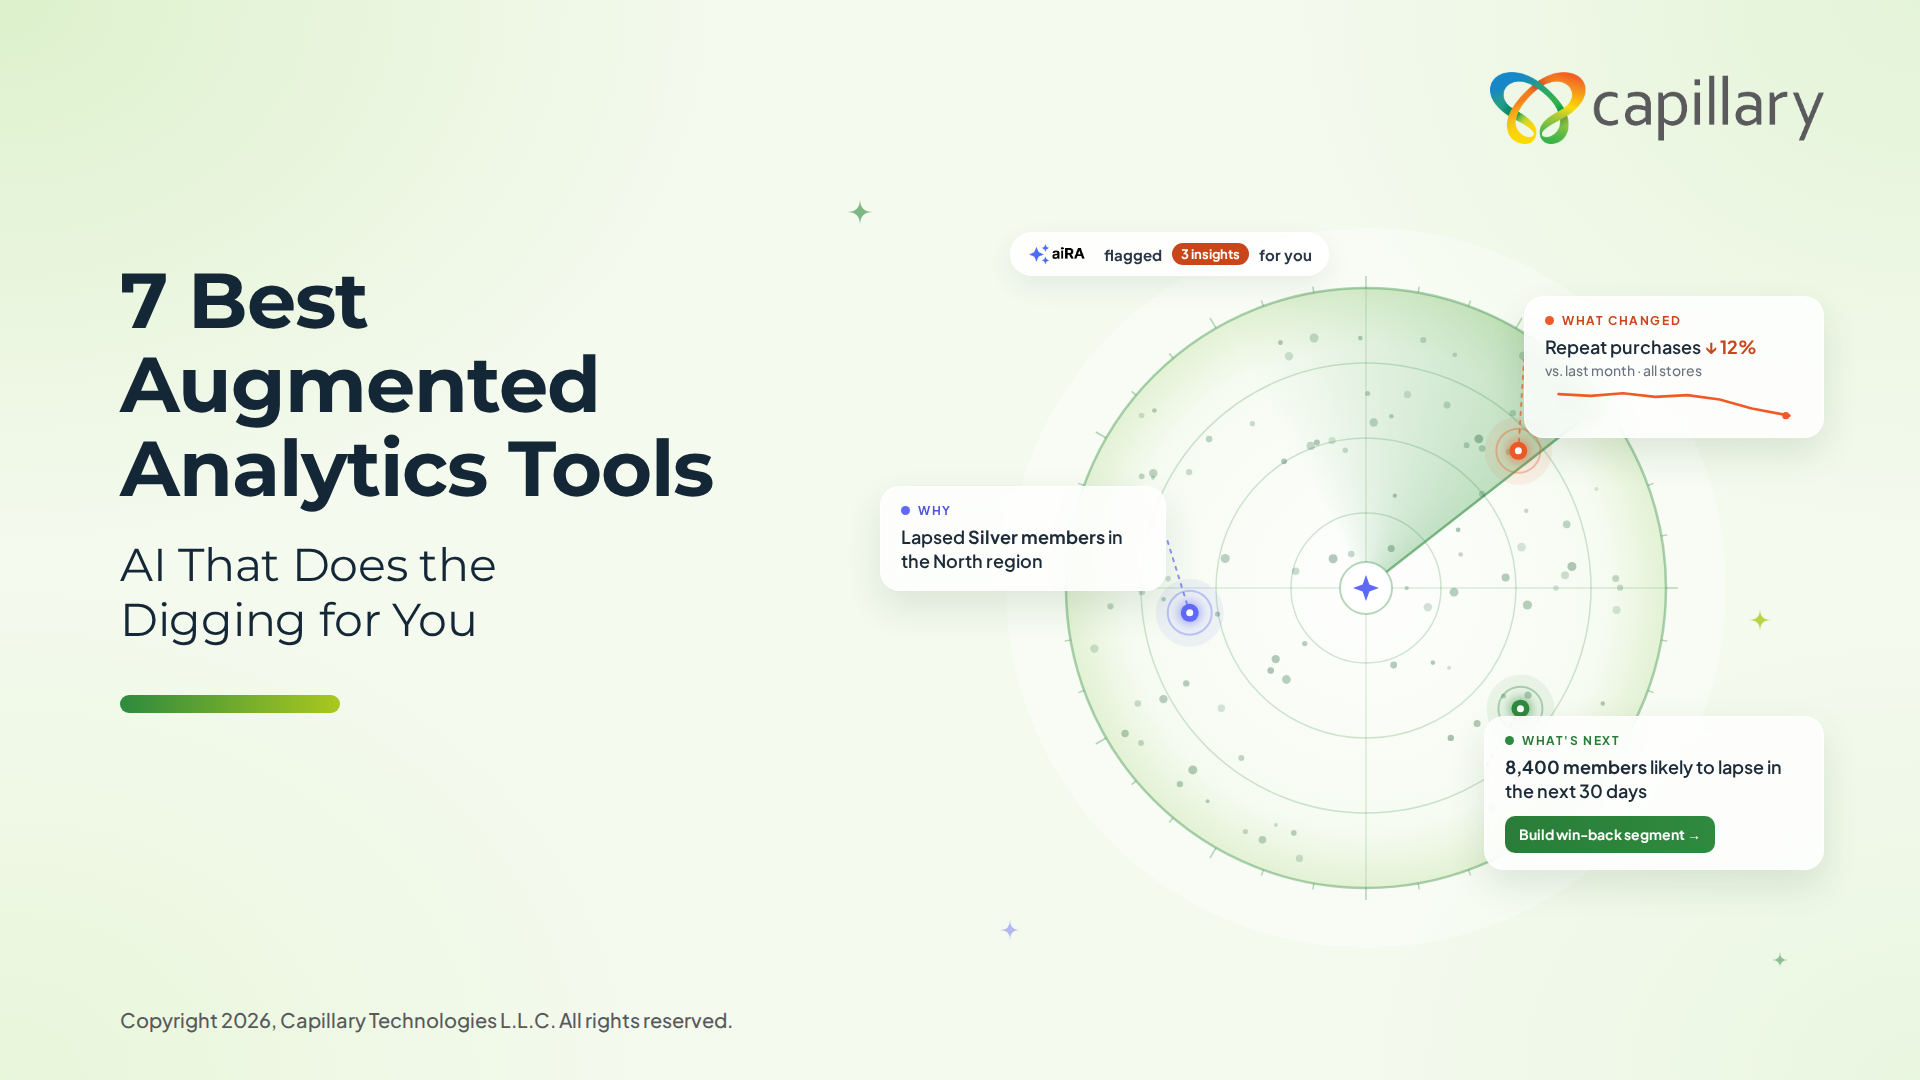
7 Best Augmented Analytics Tools for Marketing and CRM Teams in 2026
Most dashboards show you what happened, but they leave the digging to your team. Augmented
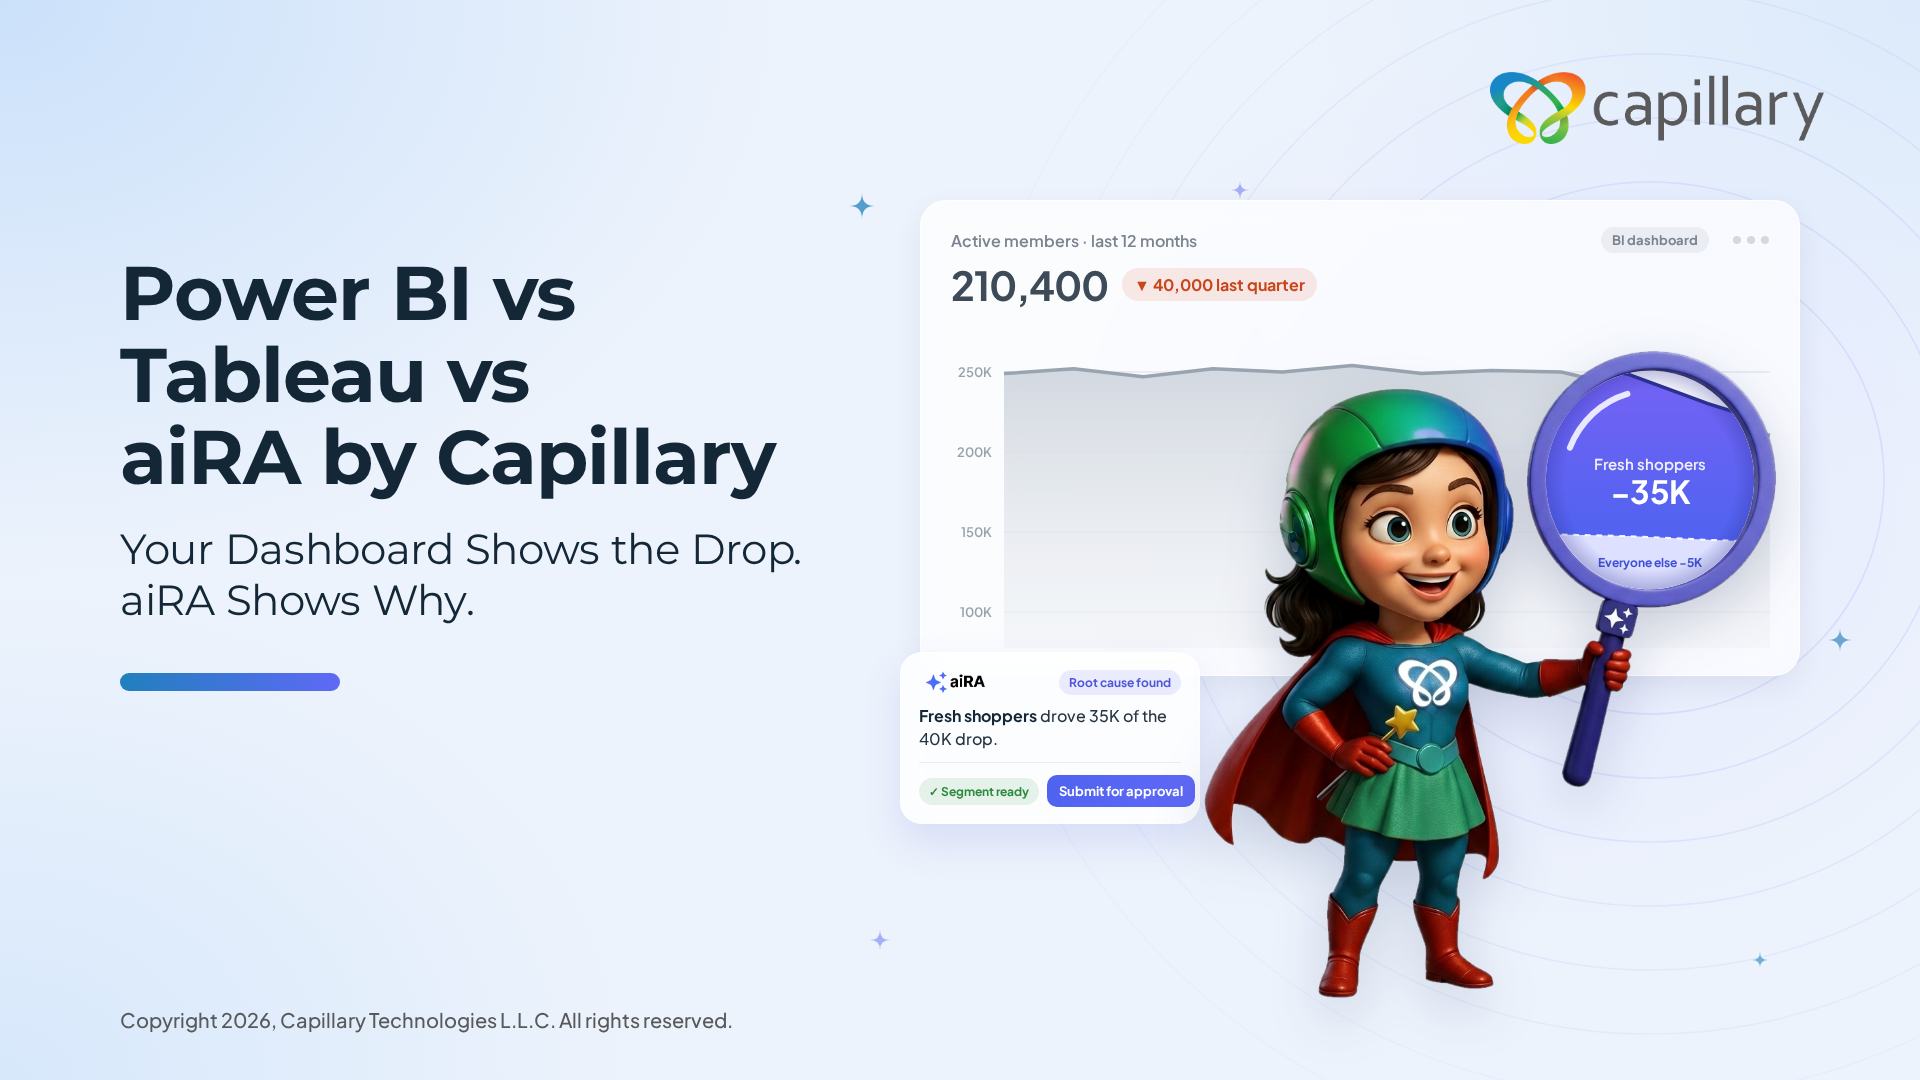
Power BI vs Tableau vs aiRA
Your Dashboard Shows the Drop. aiRA Shows Why, & What to Do About It. Power